Rock Mass Characterisation
A Virtual Field trip designed to prepare you to characterise rock masses in the field!
This Virtual Field trip is designed for students that about to participate in an Engineering Geology Field trip, and want to brush up on their field skills. We tried to make this as effective and engaging of a learning experience as is possible when you are sitting in front of a computer, by having small exercises to complete and providing you with feedback- we hope it works for you! One of the things we do to provide you with a positive experience is that every time you write something or choose an option from a drop-doiwn menu, your progress is saved. All your answers are stored as a cookie on your computer for about 2 months - if you change computers or browsers, all your progress will be lost! You can clear all the progress by pushing the reset button at the top right of the field trip
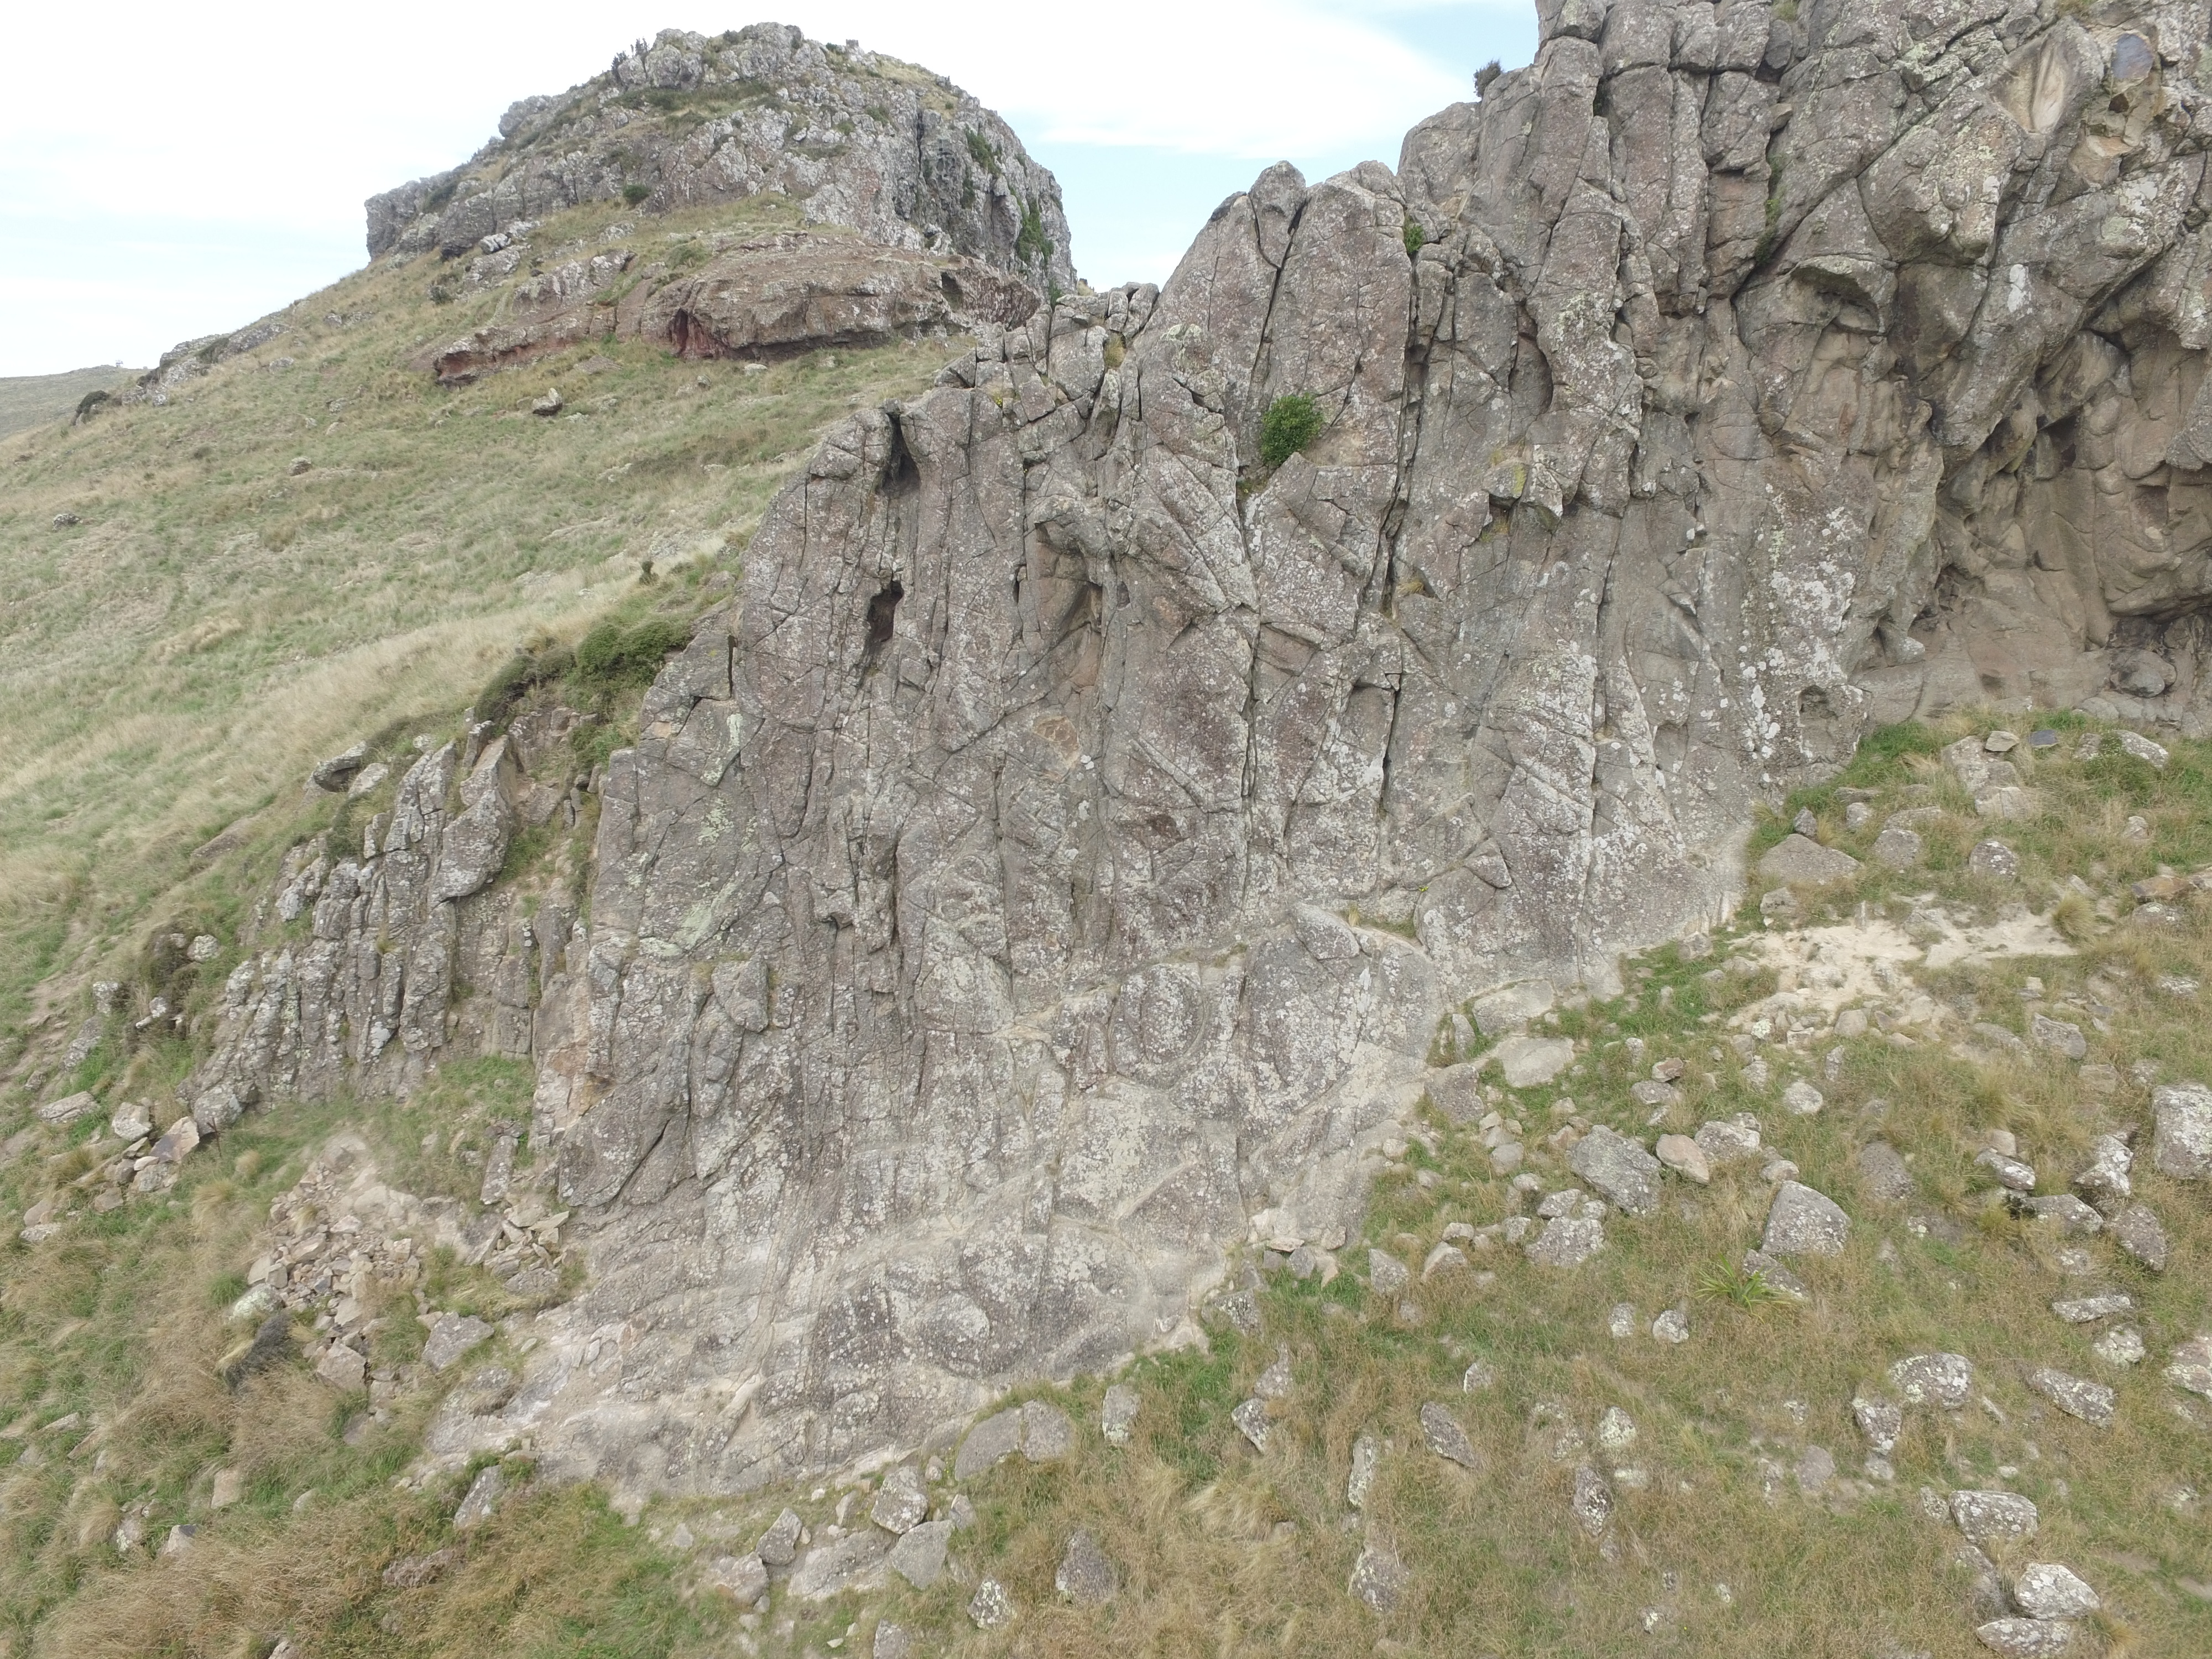
When characterising a rock mass we want to look at the nature of the rock mass holistically. This means making observations at a variety of scales. To do this we start from the large scale and gradually move towards the small scale. Before we even touch the rock, the first thing to do is observe the outcrop in its full extent from far away. A great way to do this is to take some pictures and draw a sketch. You can then use the sketch to annotate your photos when you compile your report. In this virtual field trip we will use the rock mass of the nearly vertical dyke at Rapaki Rock | Te Ahi a Tamatea in the Port Hills | Ngā Kōhatu Whakarekareka o Tamatea-pōkai-whenua of Christchurch to practice our holistic observation skills and learn how to record rock mass information in the field.

Elements of a sketch
to help you improve your own sketching!
- Lithology
Rock type, contacts, etc.
- Structure
-
Any form of discontinuity
These can be very small or quite large!
- Behaviour
What you're looking for here is evidence of failure to inform future behaviour.
- Map elements
-
This involves:
- Scale
- Orientation
- Legend
- etc.
Often forgotten, but your sketch is useless without them!
A sketch example of Te Ahi a Tamatea
Let's see what you think!
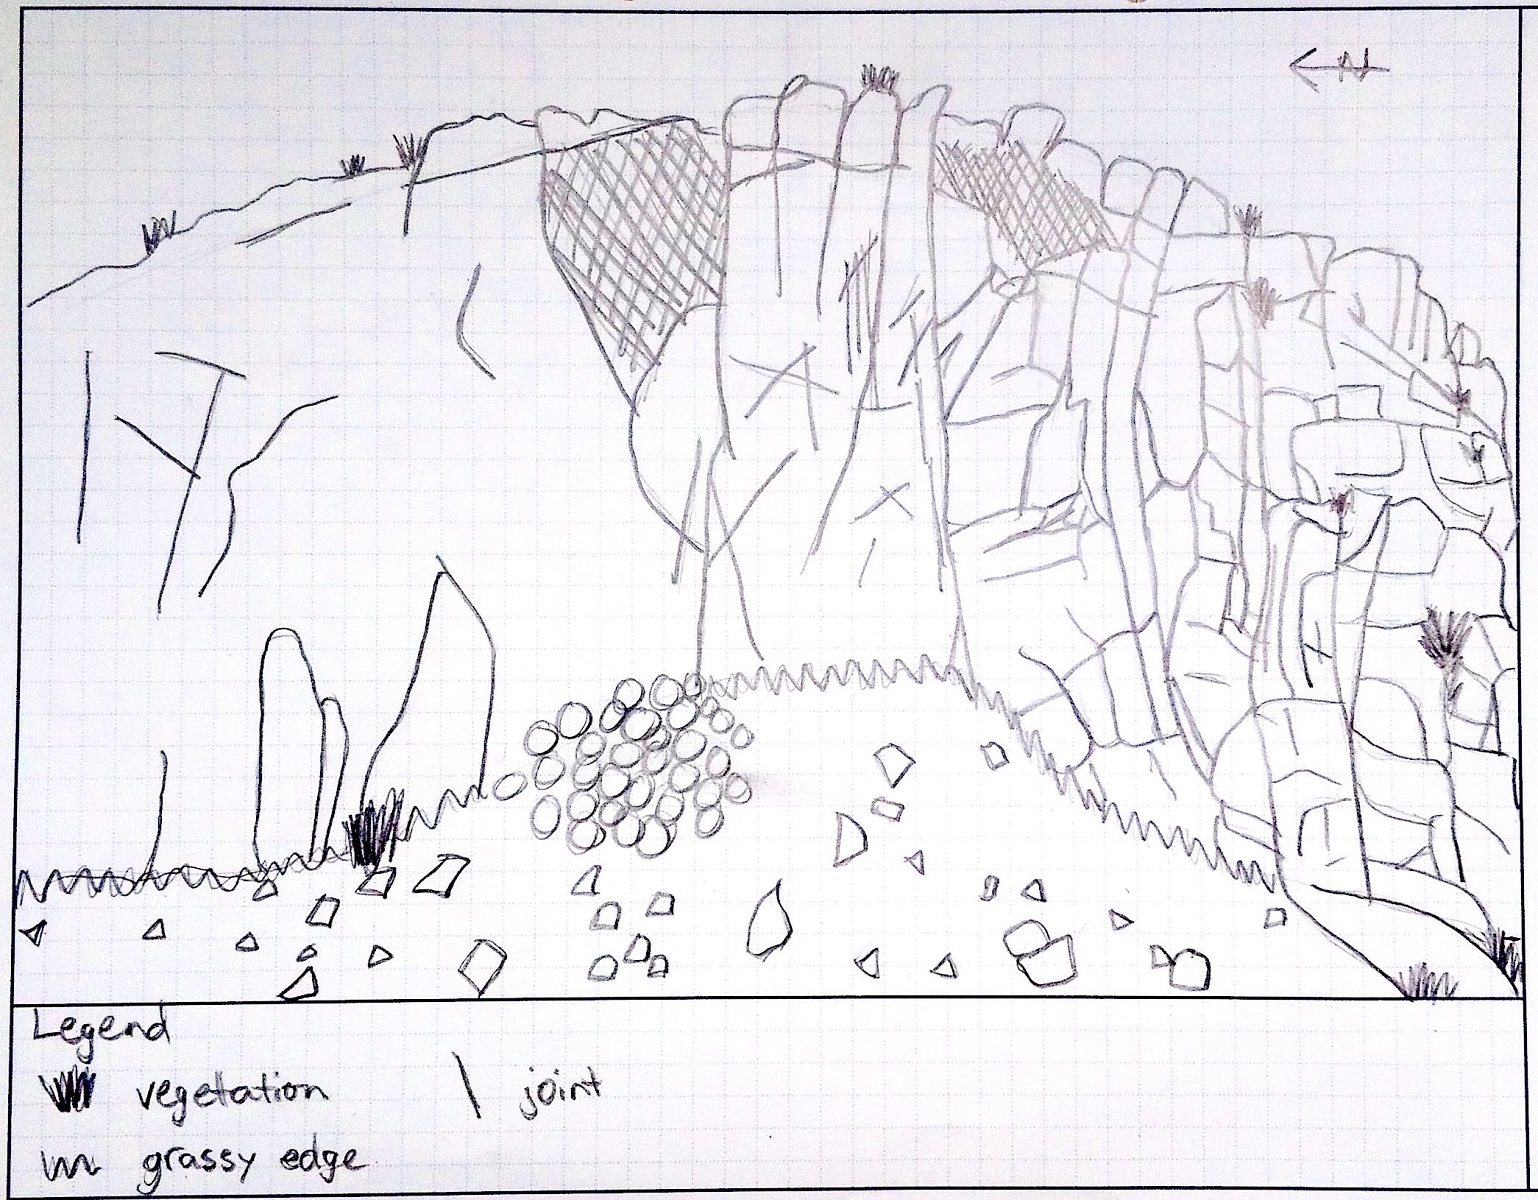
Click on the pink circle in the bottom right of the padlet to add your comments. Please comment on what you think was well done and what you think is missing or could be done better
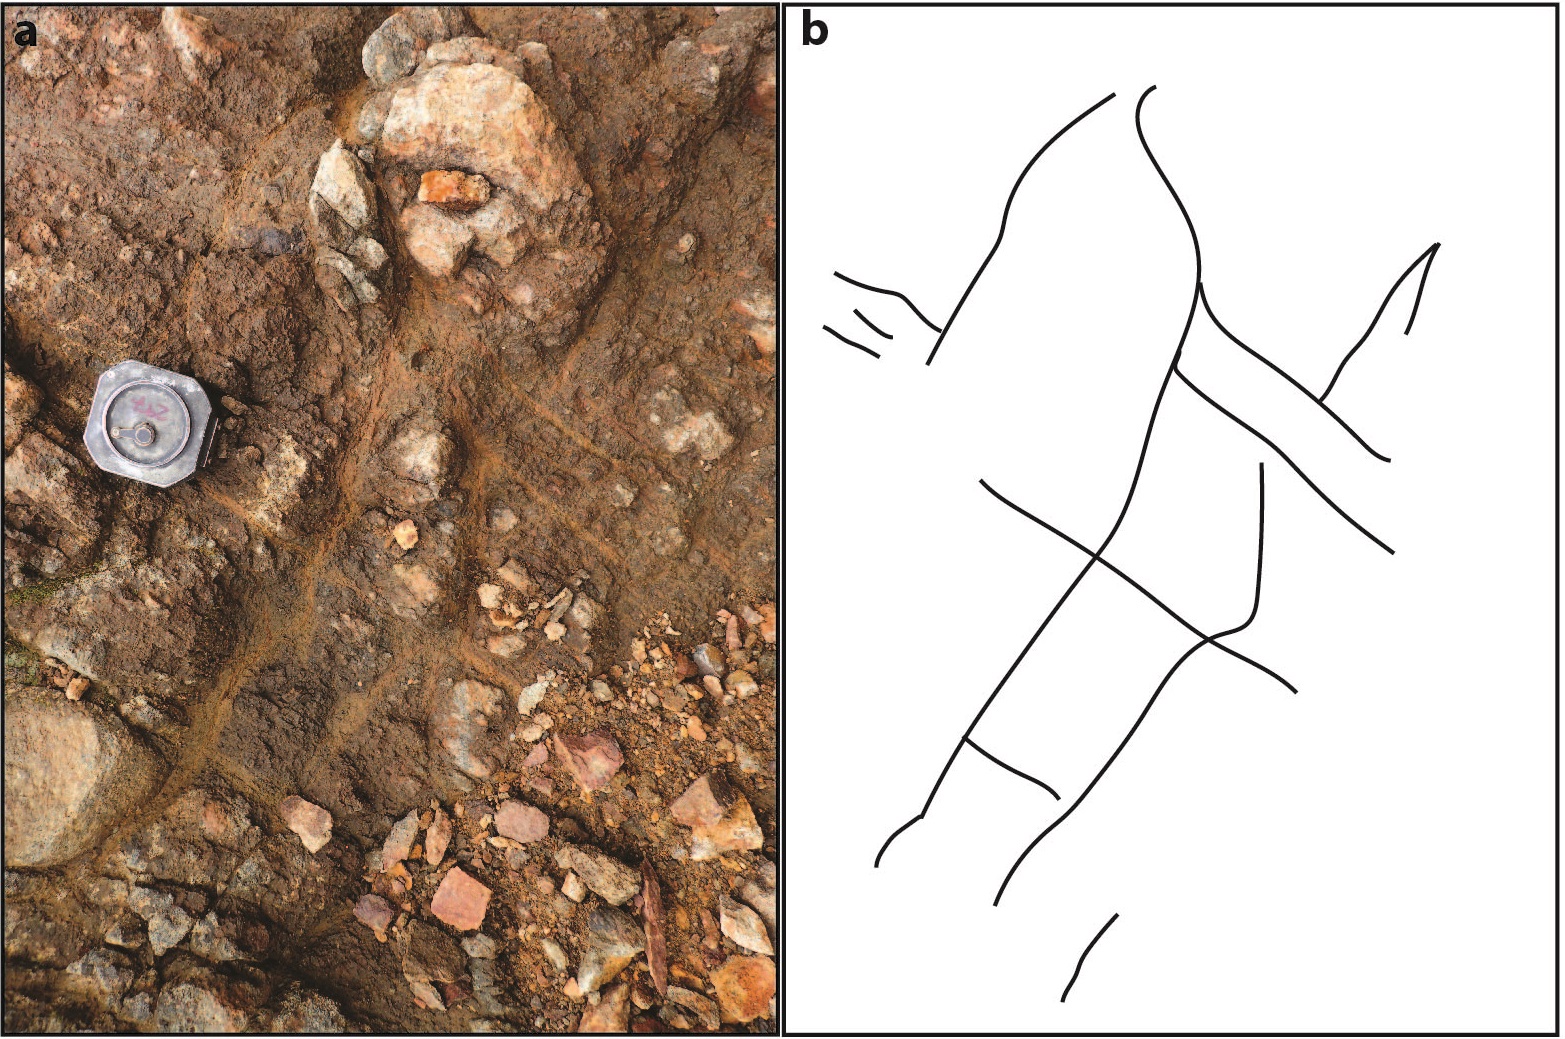
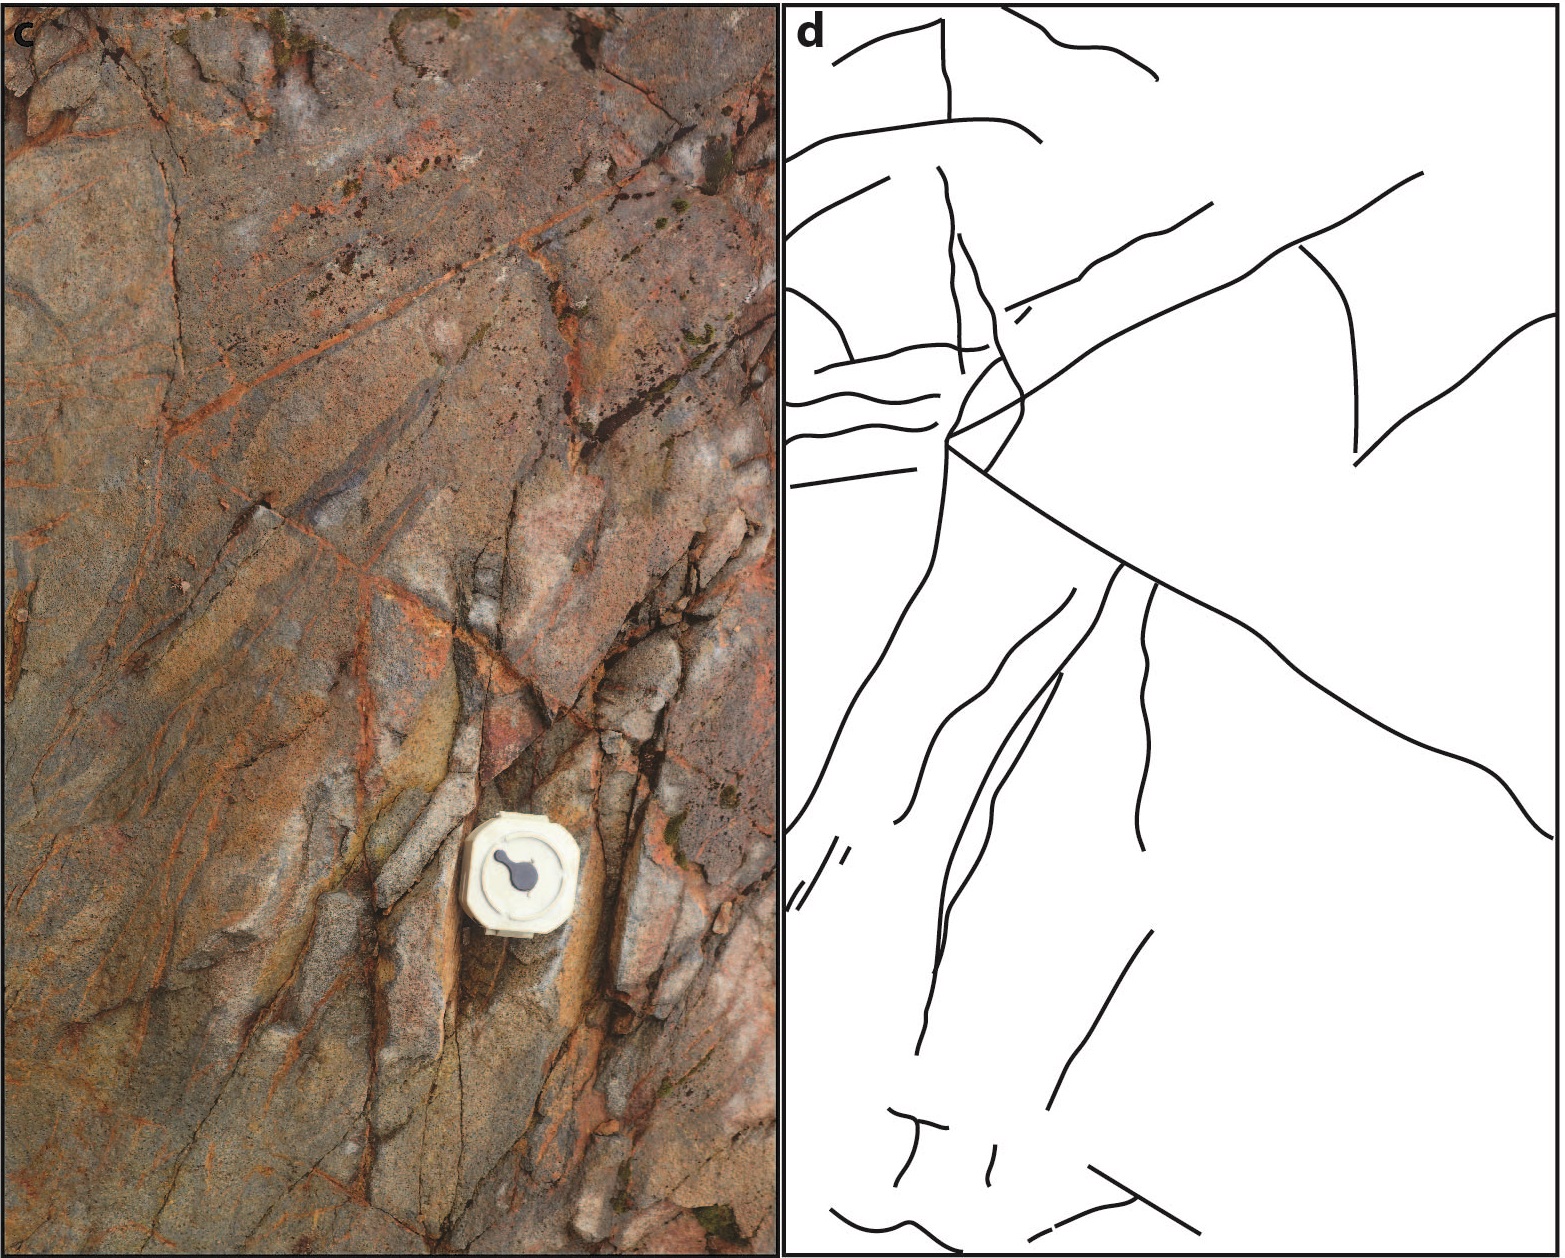
Now that we are familiar with the outcrop, let's have a look at some of the key components of a rock mass that we can observe and record. One of the most important aspects of a rock mass after lithology is the discontinuities. Click on the arrows on the sides of the photo to scroll through the main types of discontinuities.
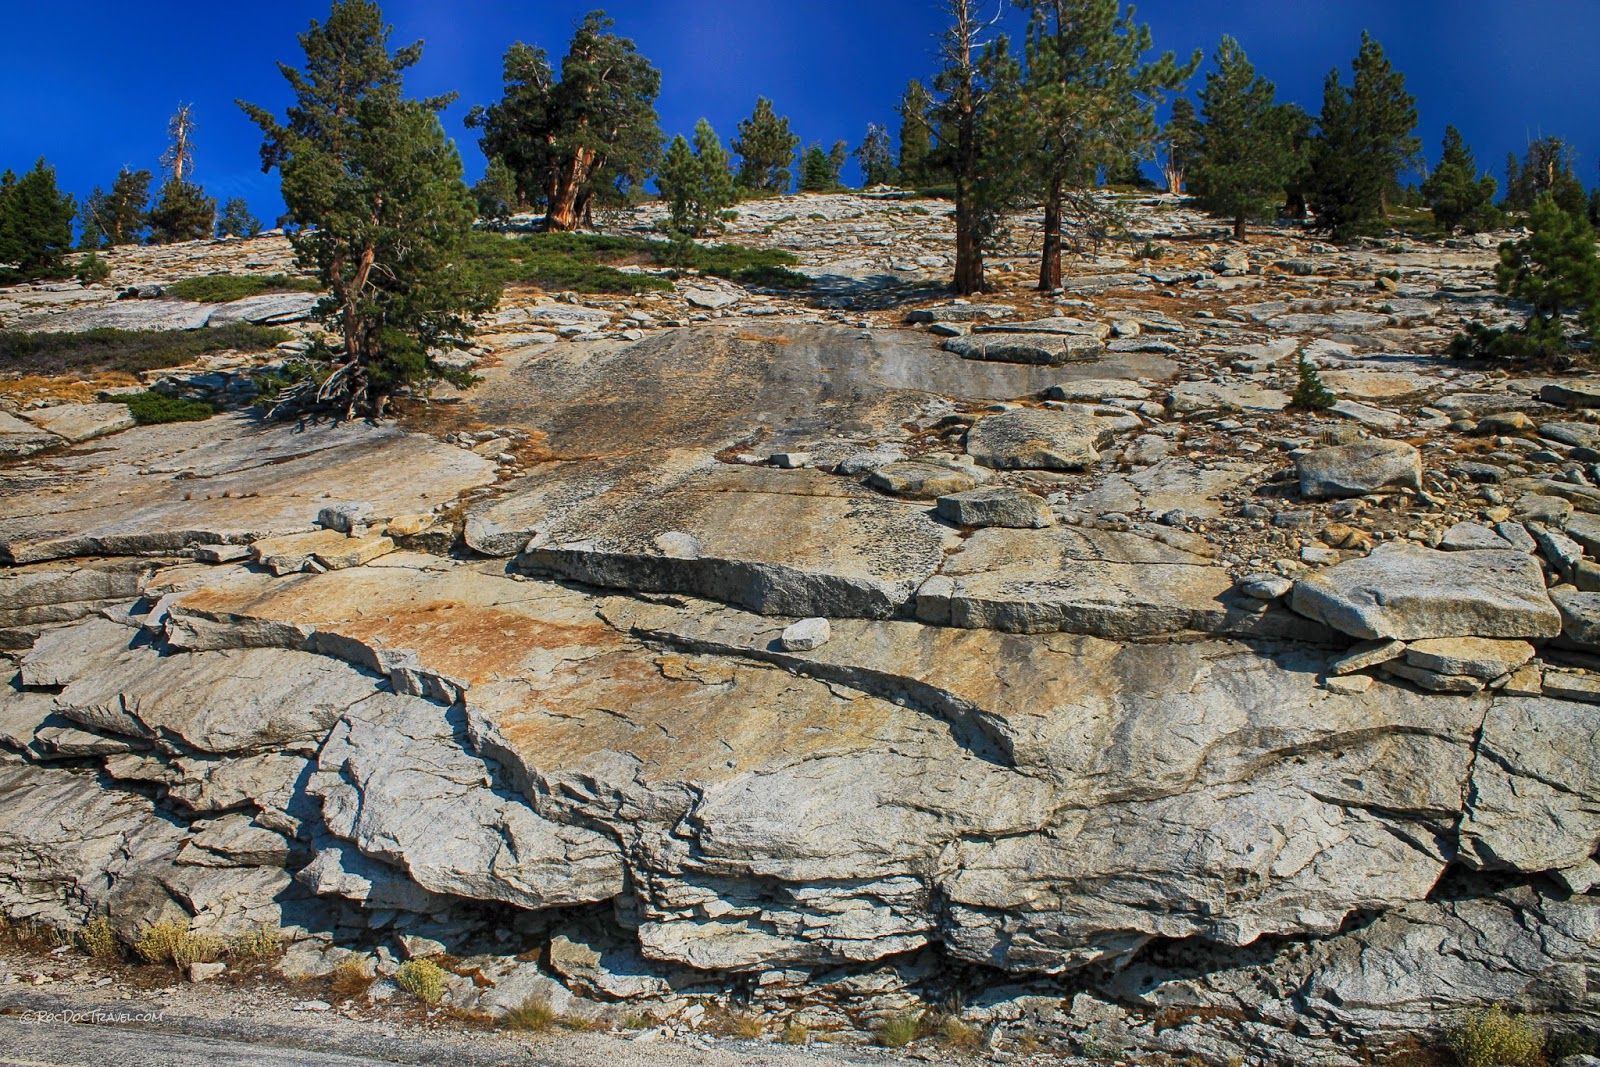
Joints
- most common
- normally in sets
- many scales
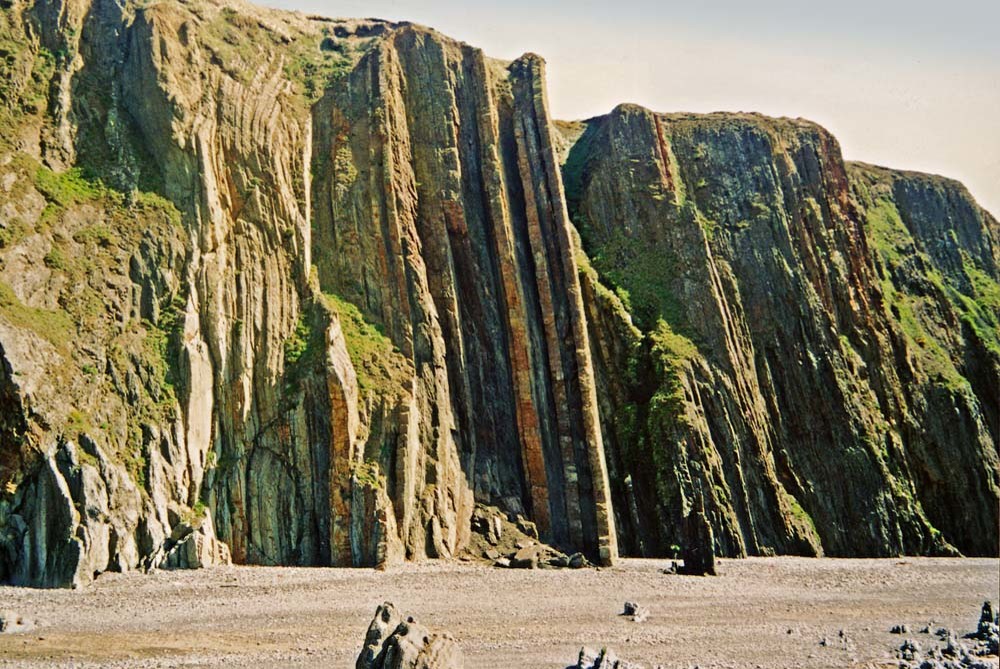
Bedding
- parallel
- large-scale
Faults
- singular
- large-scale
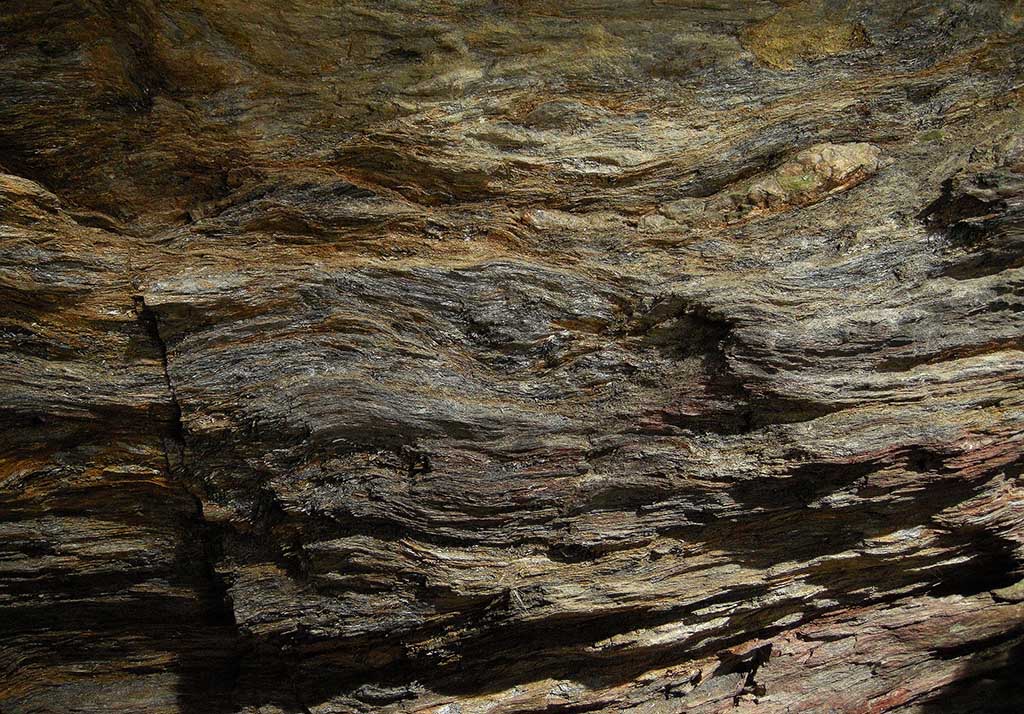
Foliation
- parallel
- small scale
- pervasive
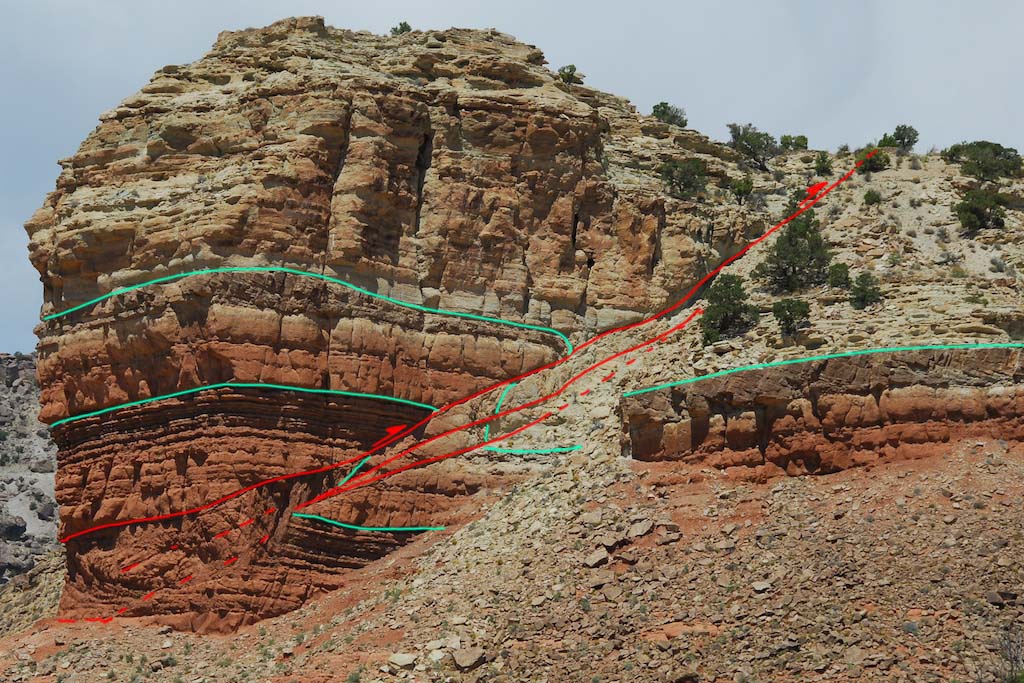
Discontinuities are typically described at two scales: the metre scale and the centimetre scale. There are different characteristics that we describe at each of these scales. In following our pattern of observing from far then moving in closer, let's look at metre scale first.
Metre scale rock mass description
Bringing it all together - Check out this model to answer the questions below!
Below you will see a 3D model of an Outcrop. Once it's properly loaded, you'll notice some tools on the bottom left hand side. You can move around and zoom by scrolling and double-clicking on the model, and a right-click will allow you to tilt the view. We've also added a few imporant viewpoints to guide you as it can be difficult to navigate the 3D space. You can measure distances using the little ruler- that tool will be handy to measure spacing and persistence!
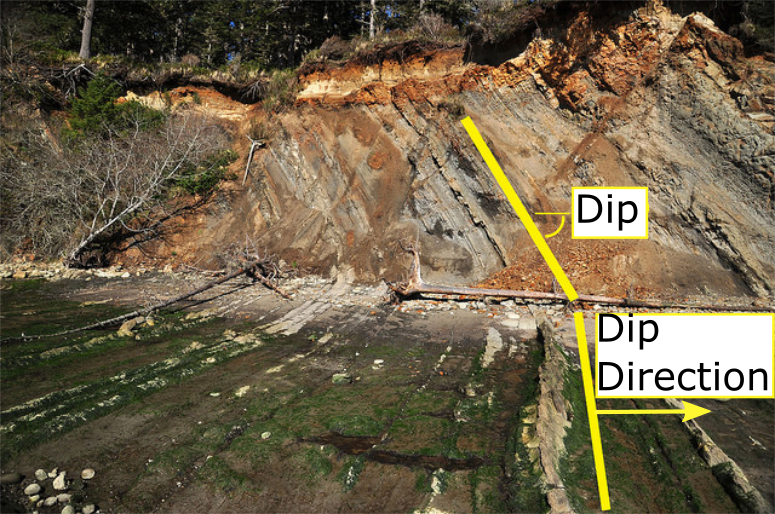
Identify key discontinuity characteristics (in general)
The dyke strikes north-south. Knowing this you can give a general dip direction of the discontinuities. Make a description of 2-3 sets of discontinuities.
+ Add another set
+ Add another set
Feedback
Click on the button below to get feedback on your answer
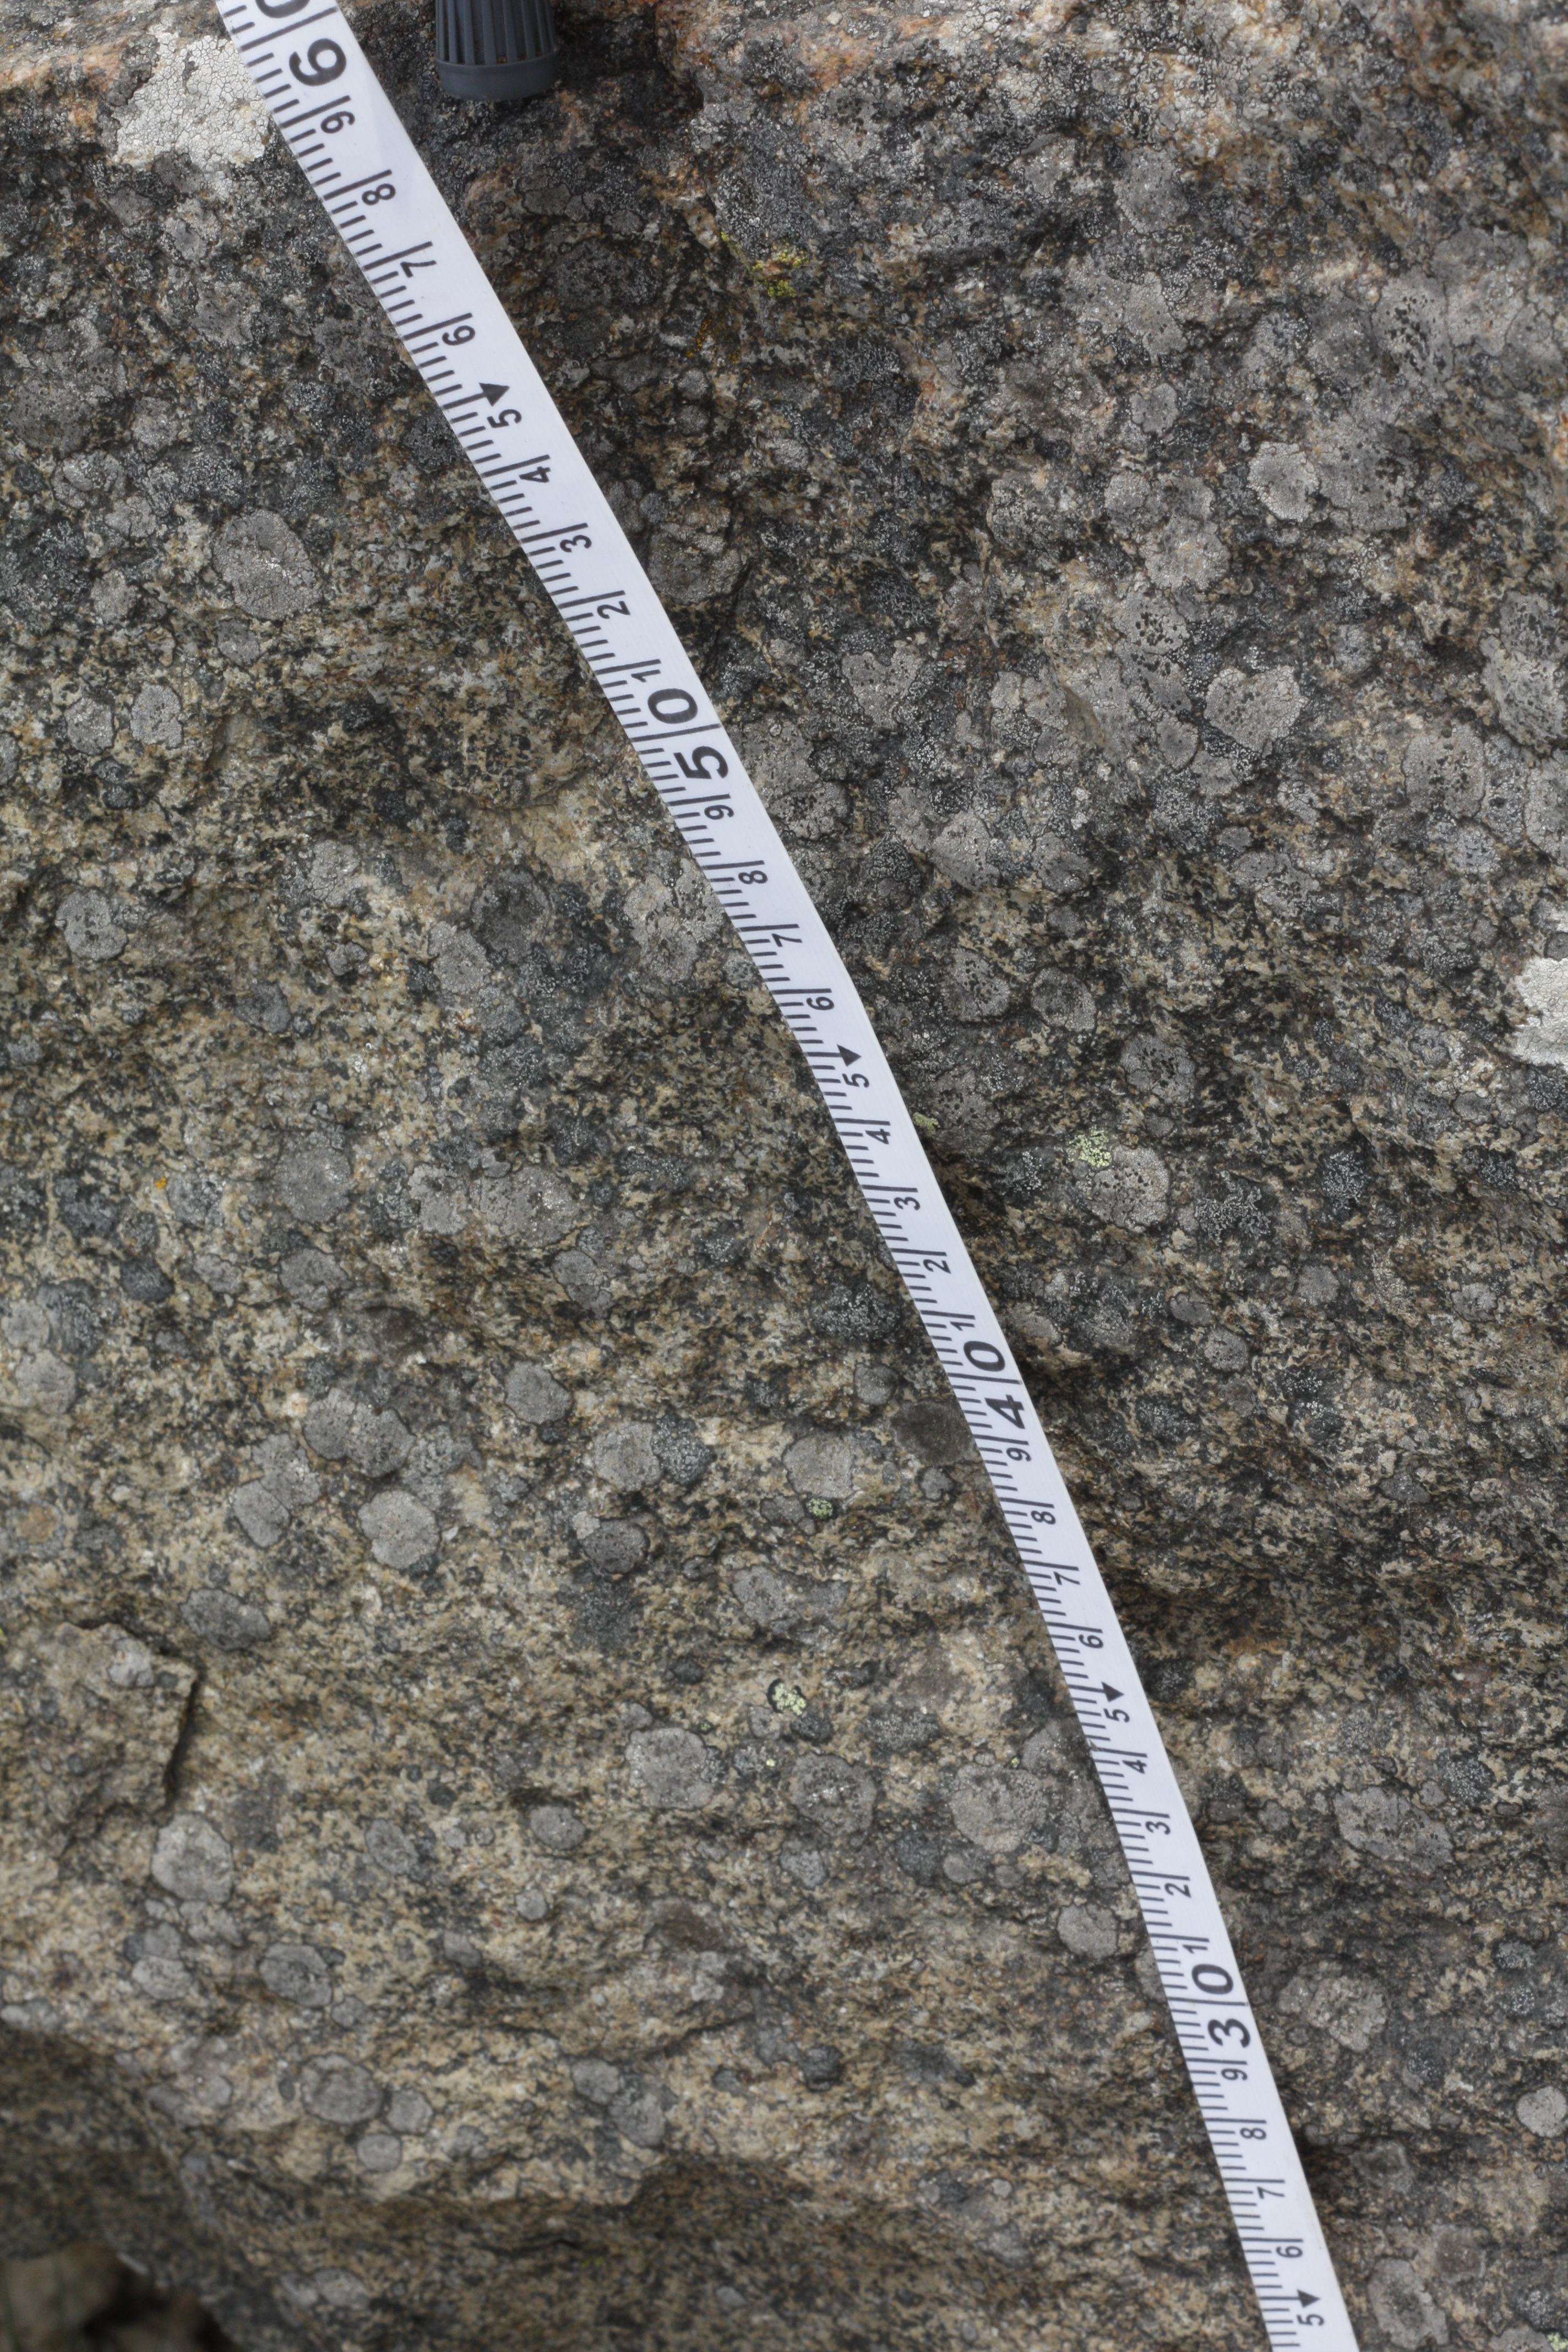
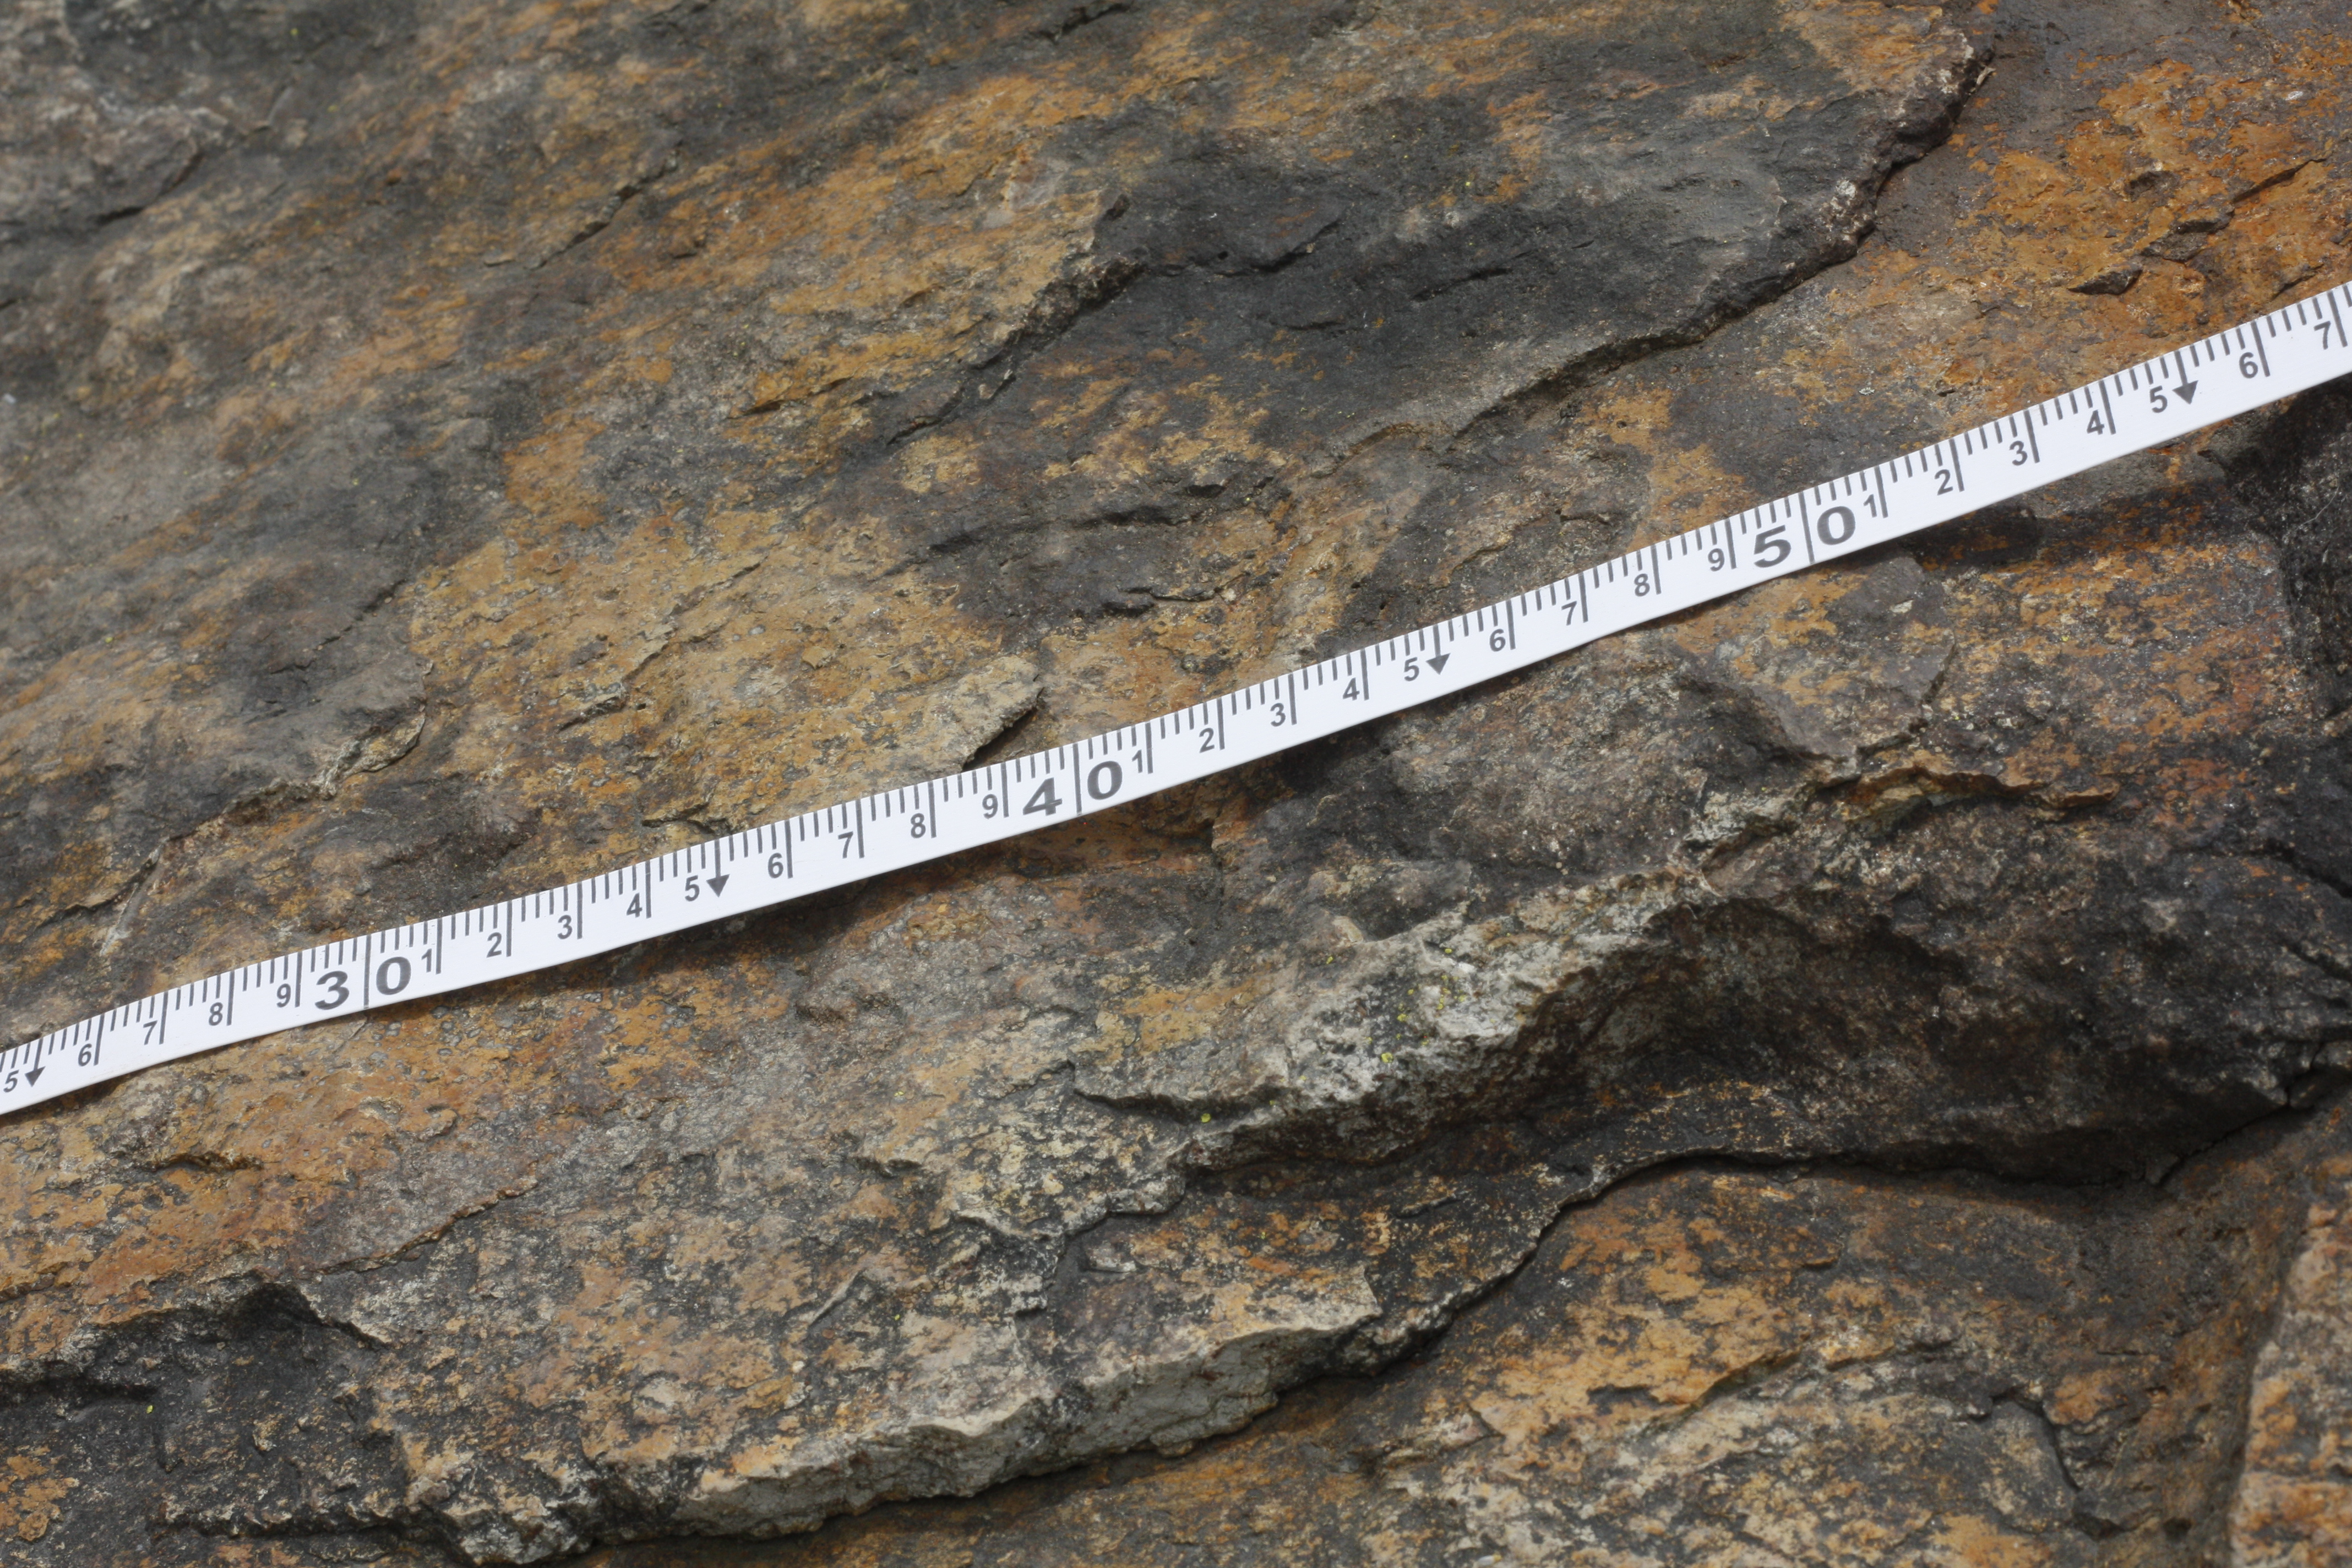
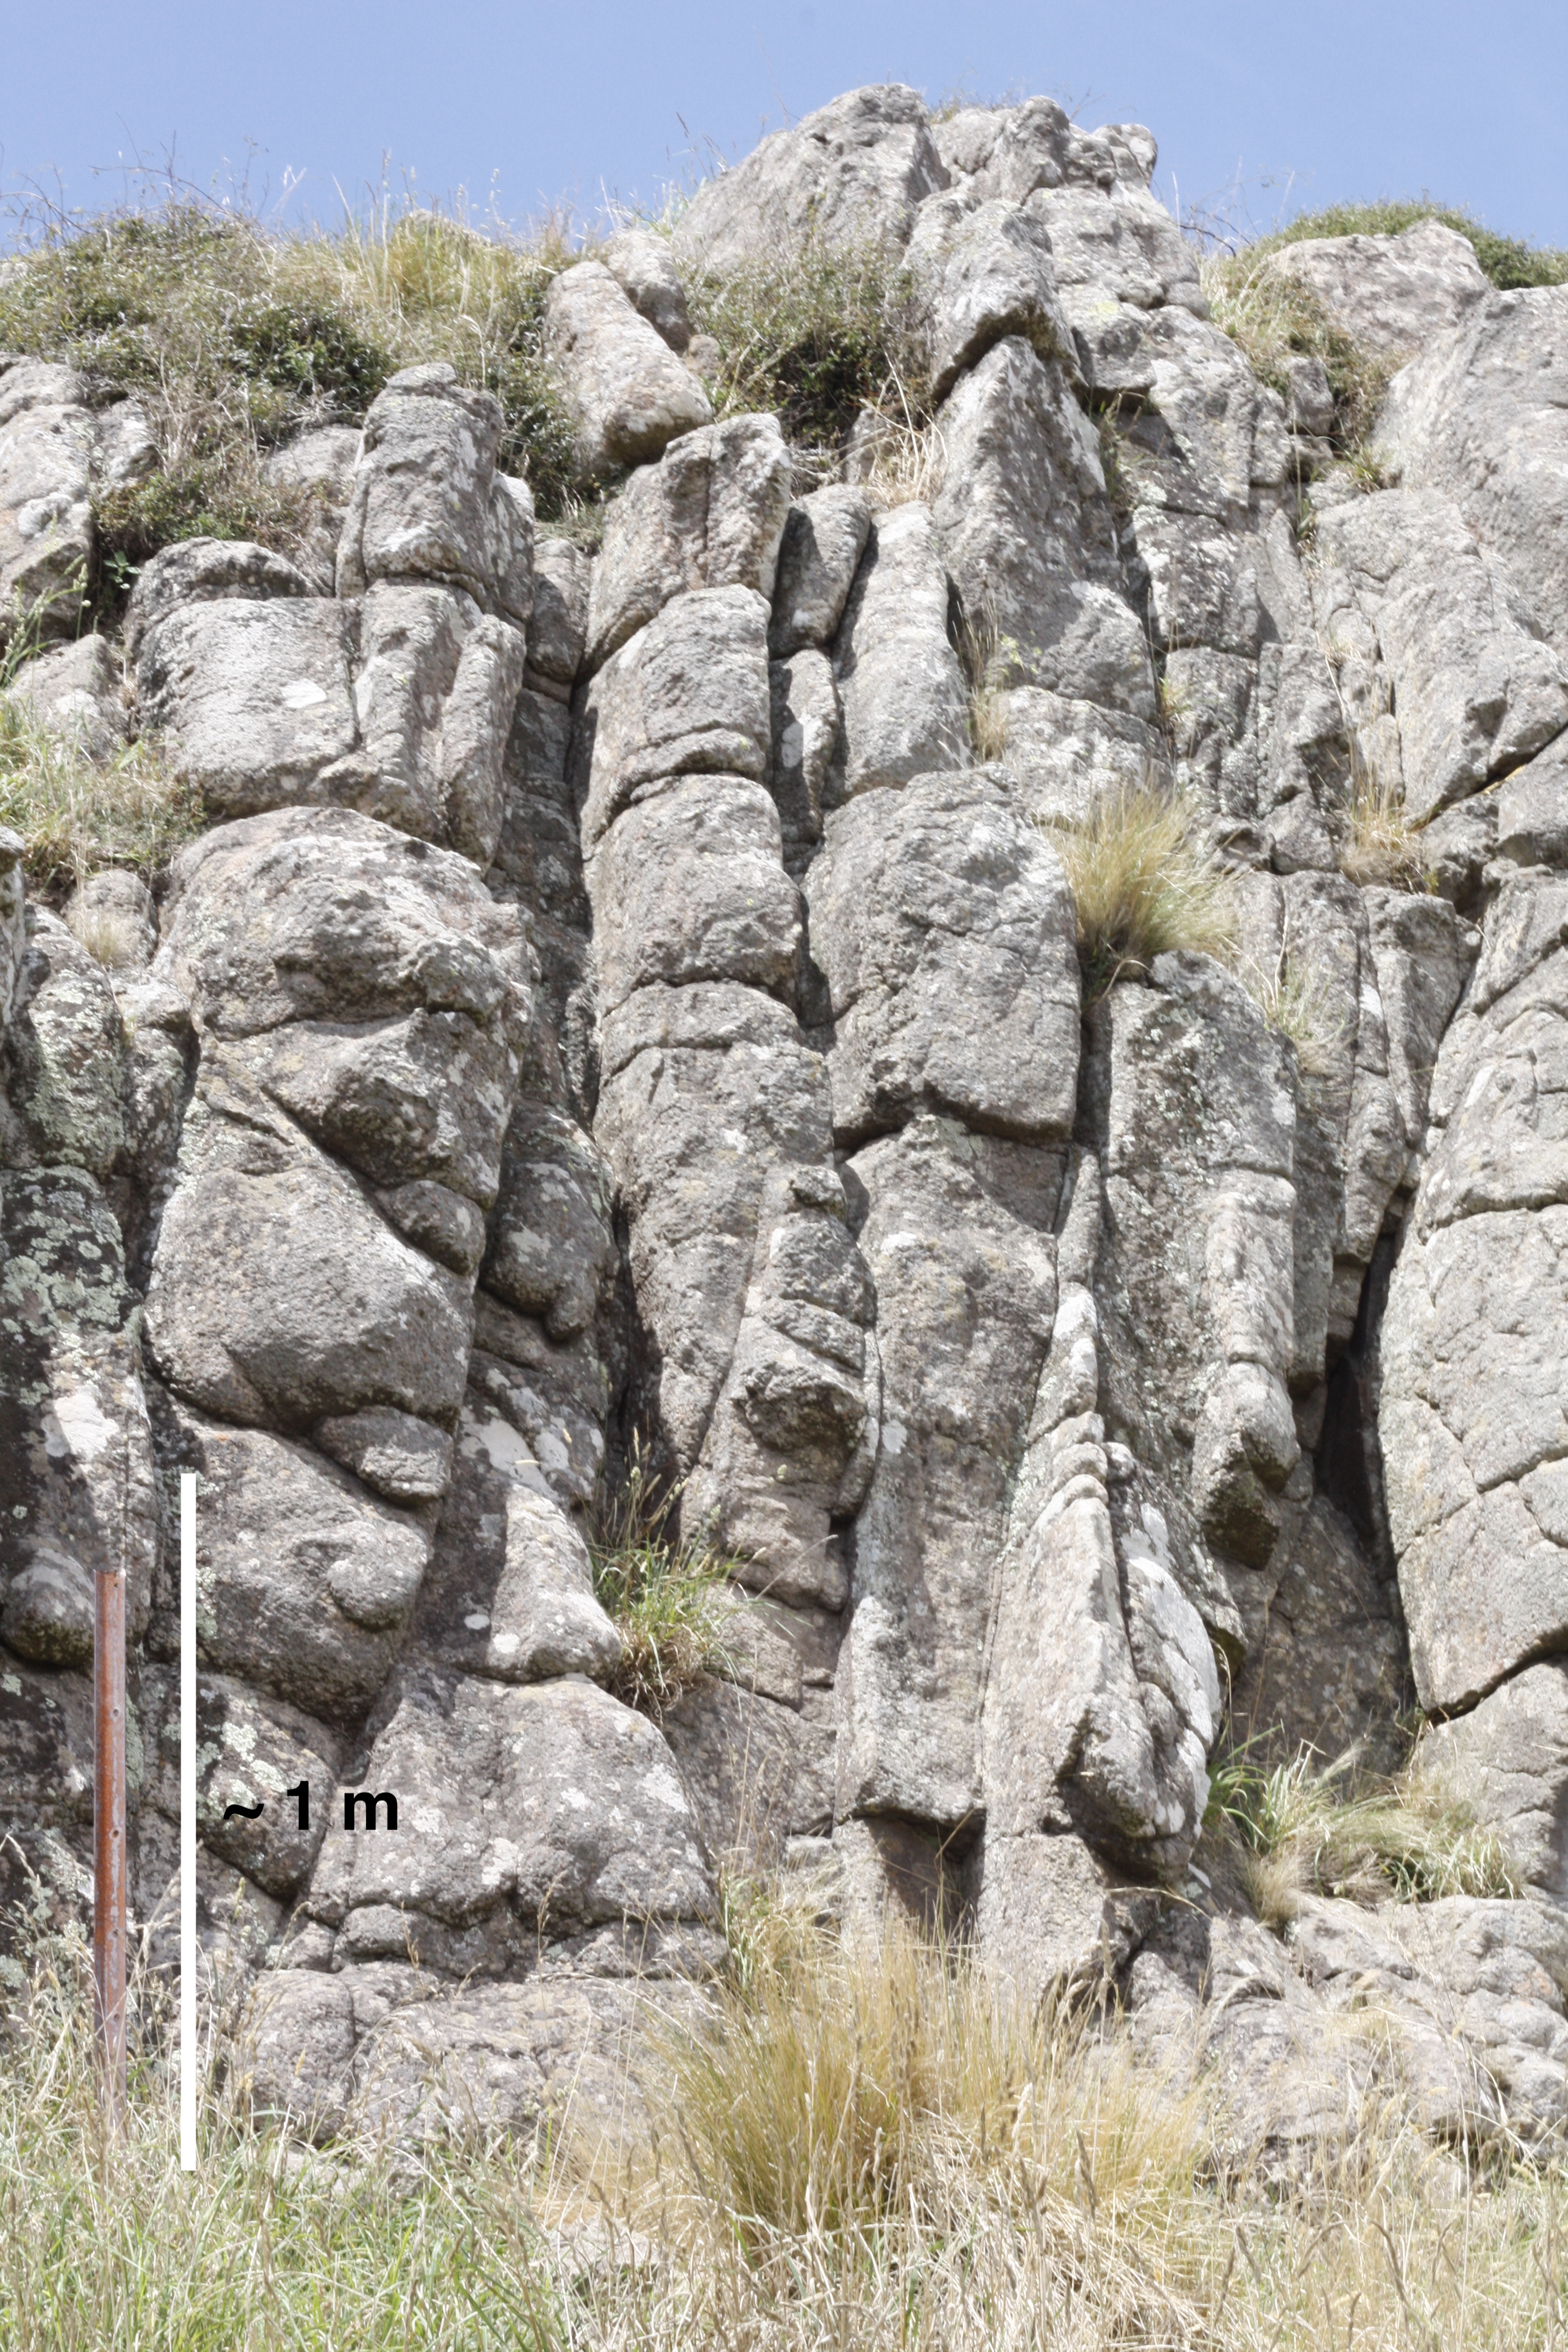
Centimetre scale discontinuity description
Use this photo to answer the questions below! Note the rock hammer for scale.
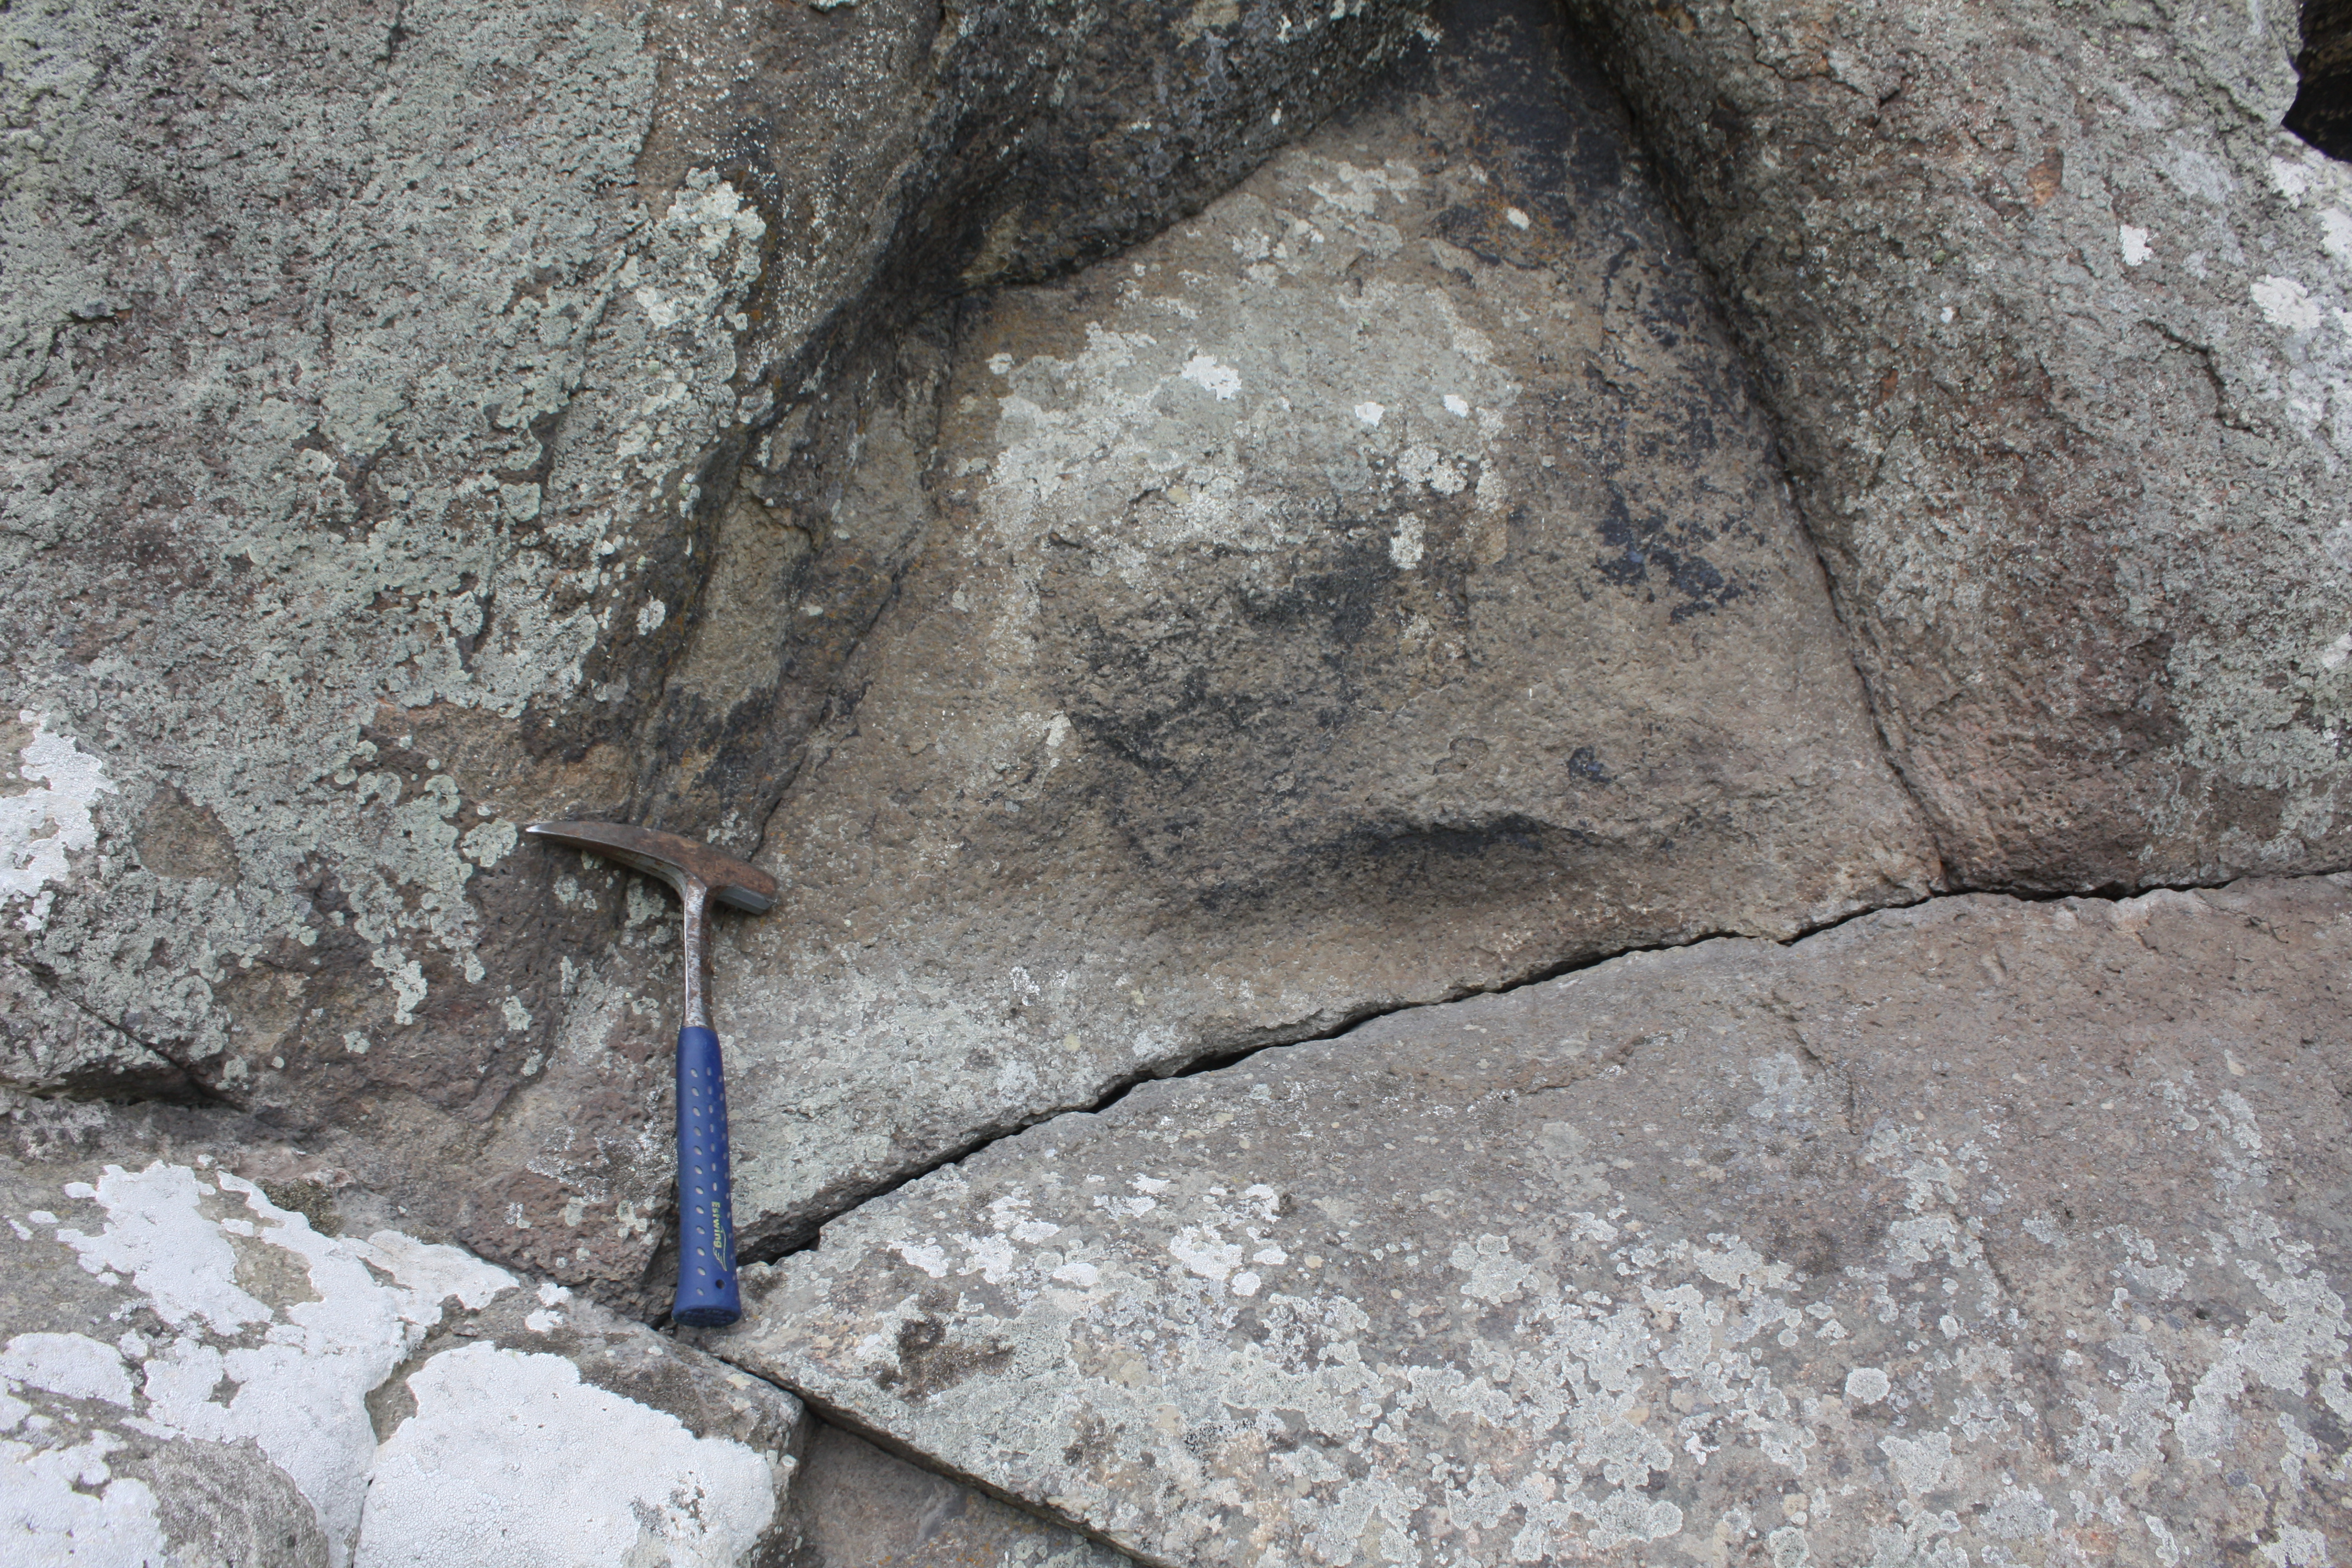
Identify key discontinuity characteristics for the horizontal discontinuity
Feedback
Click on the button below to get feedback on your answer
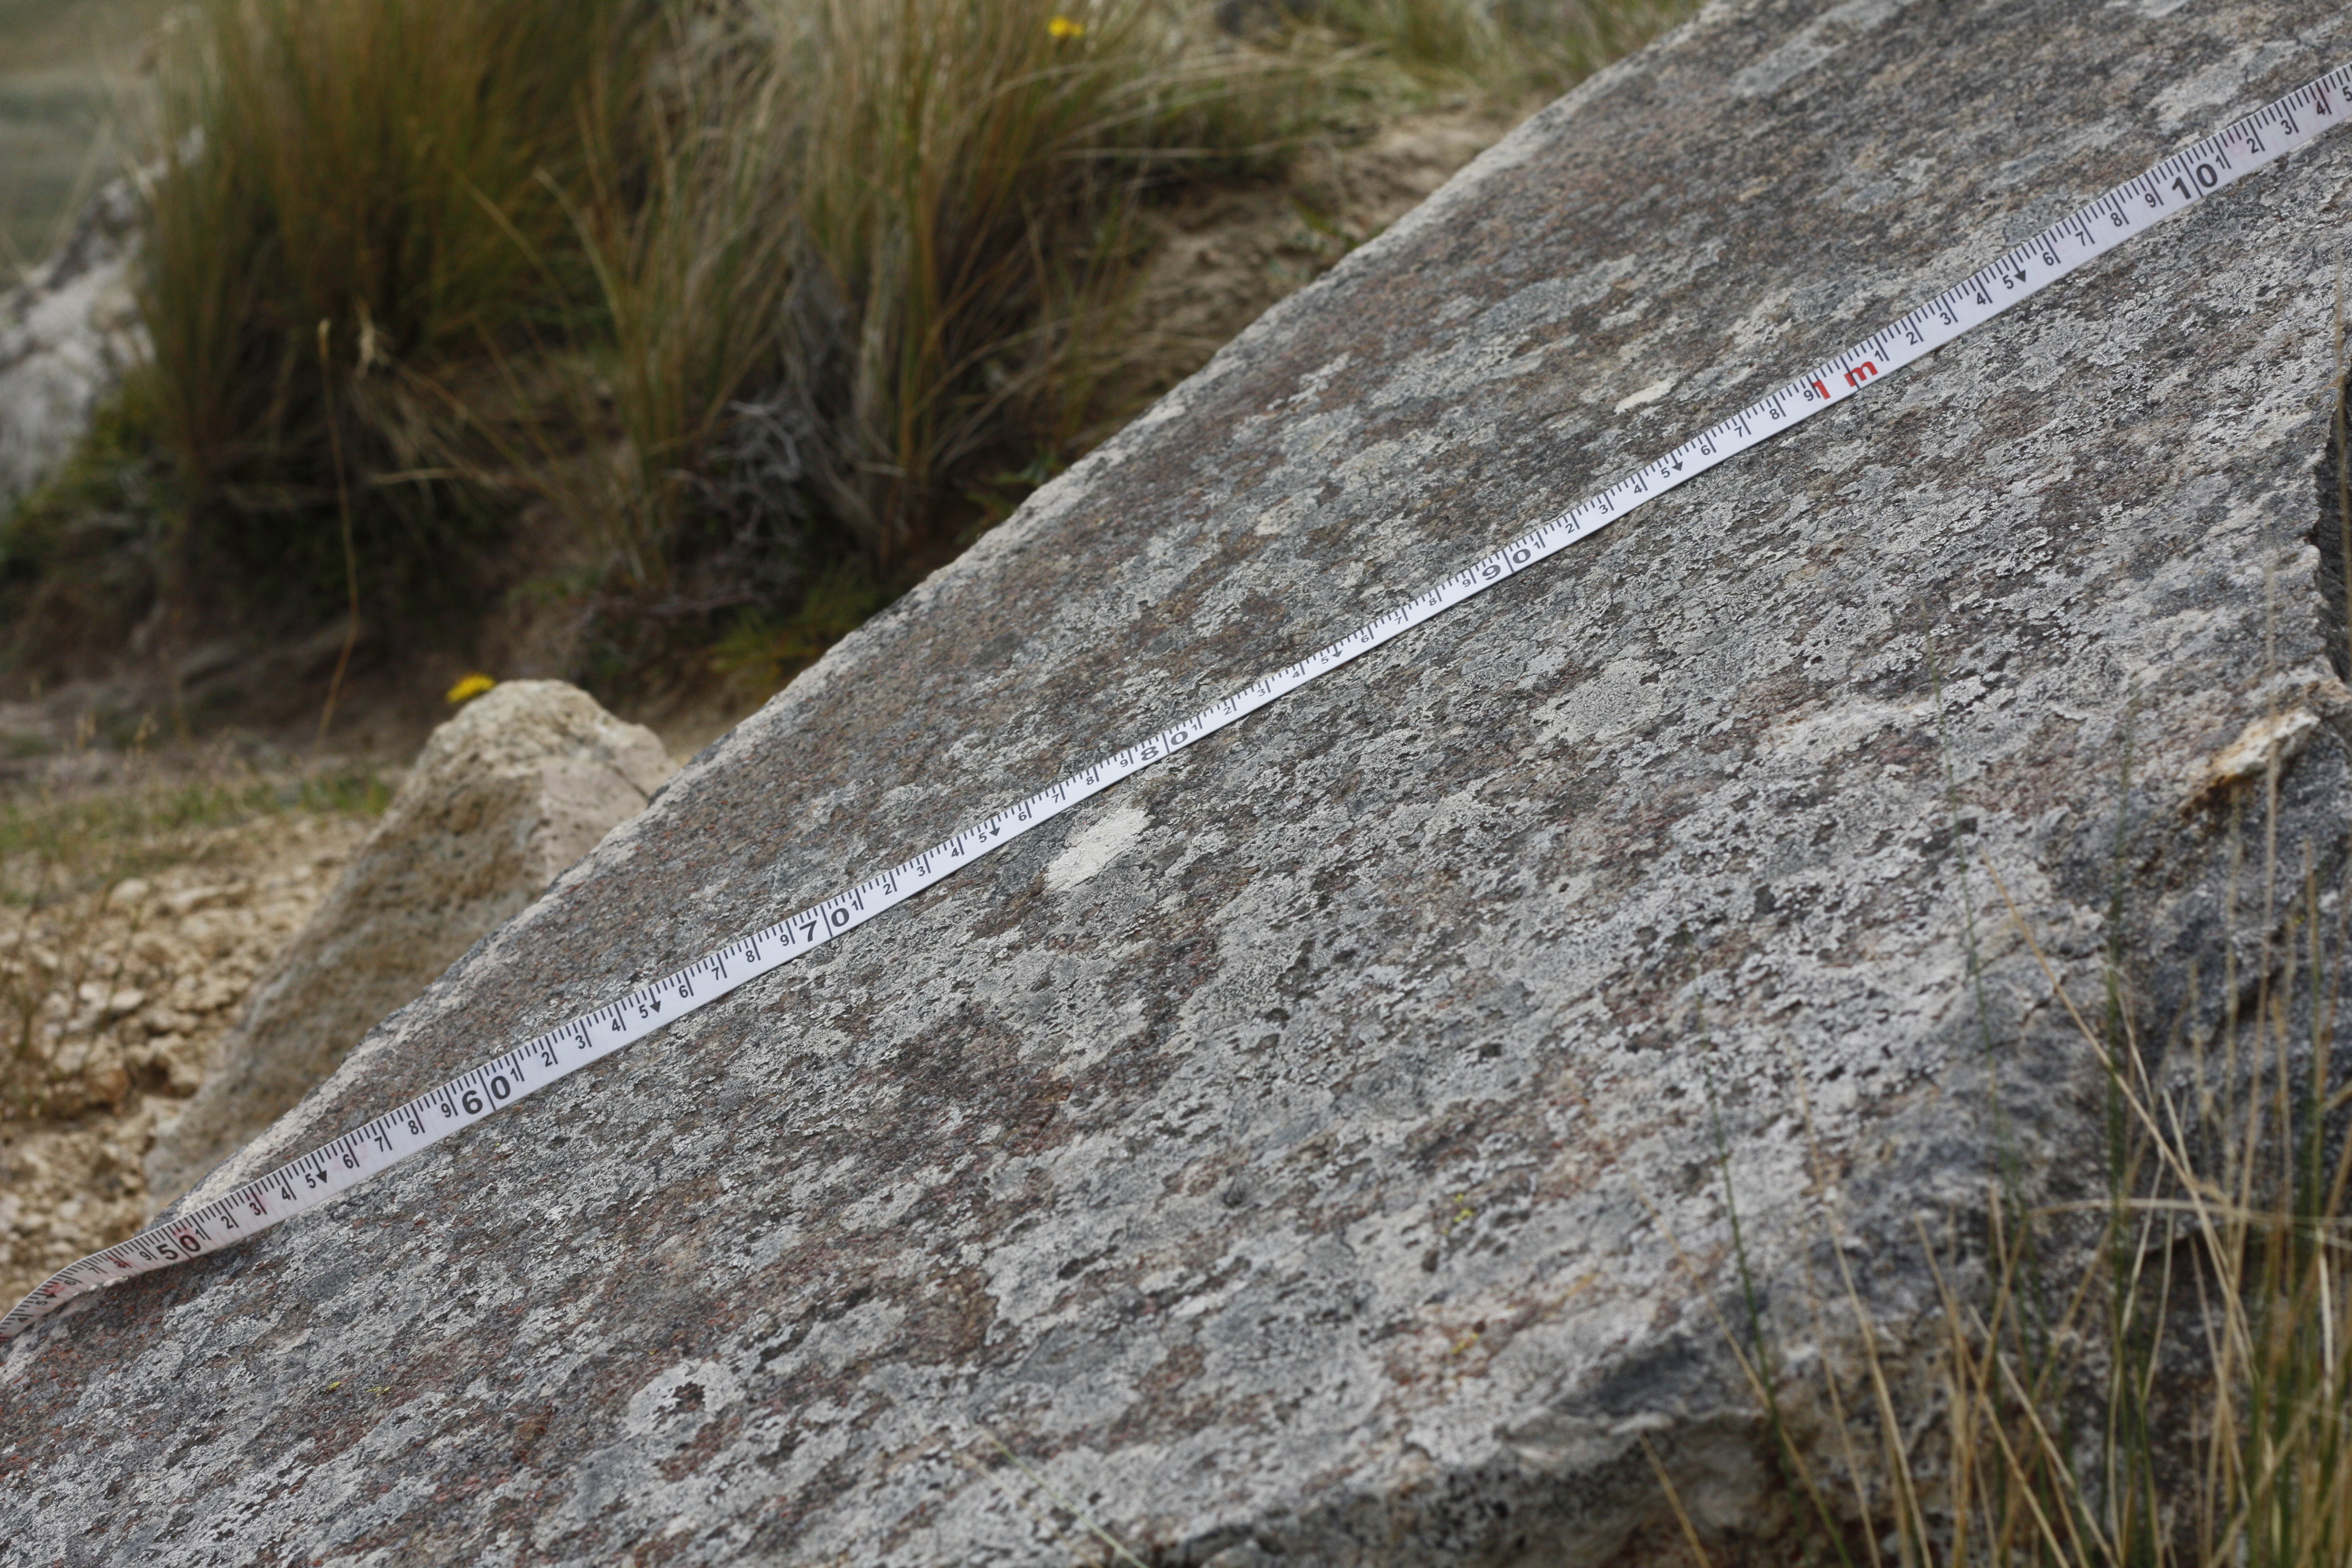
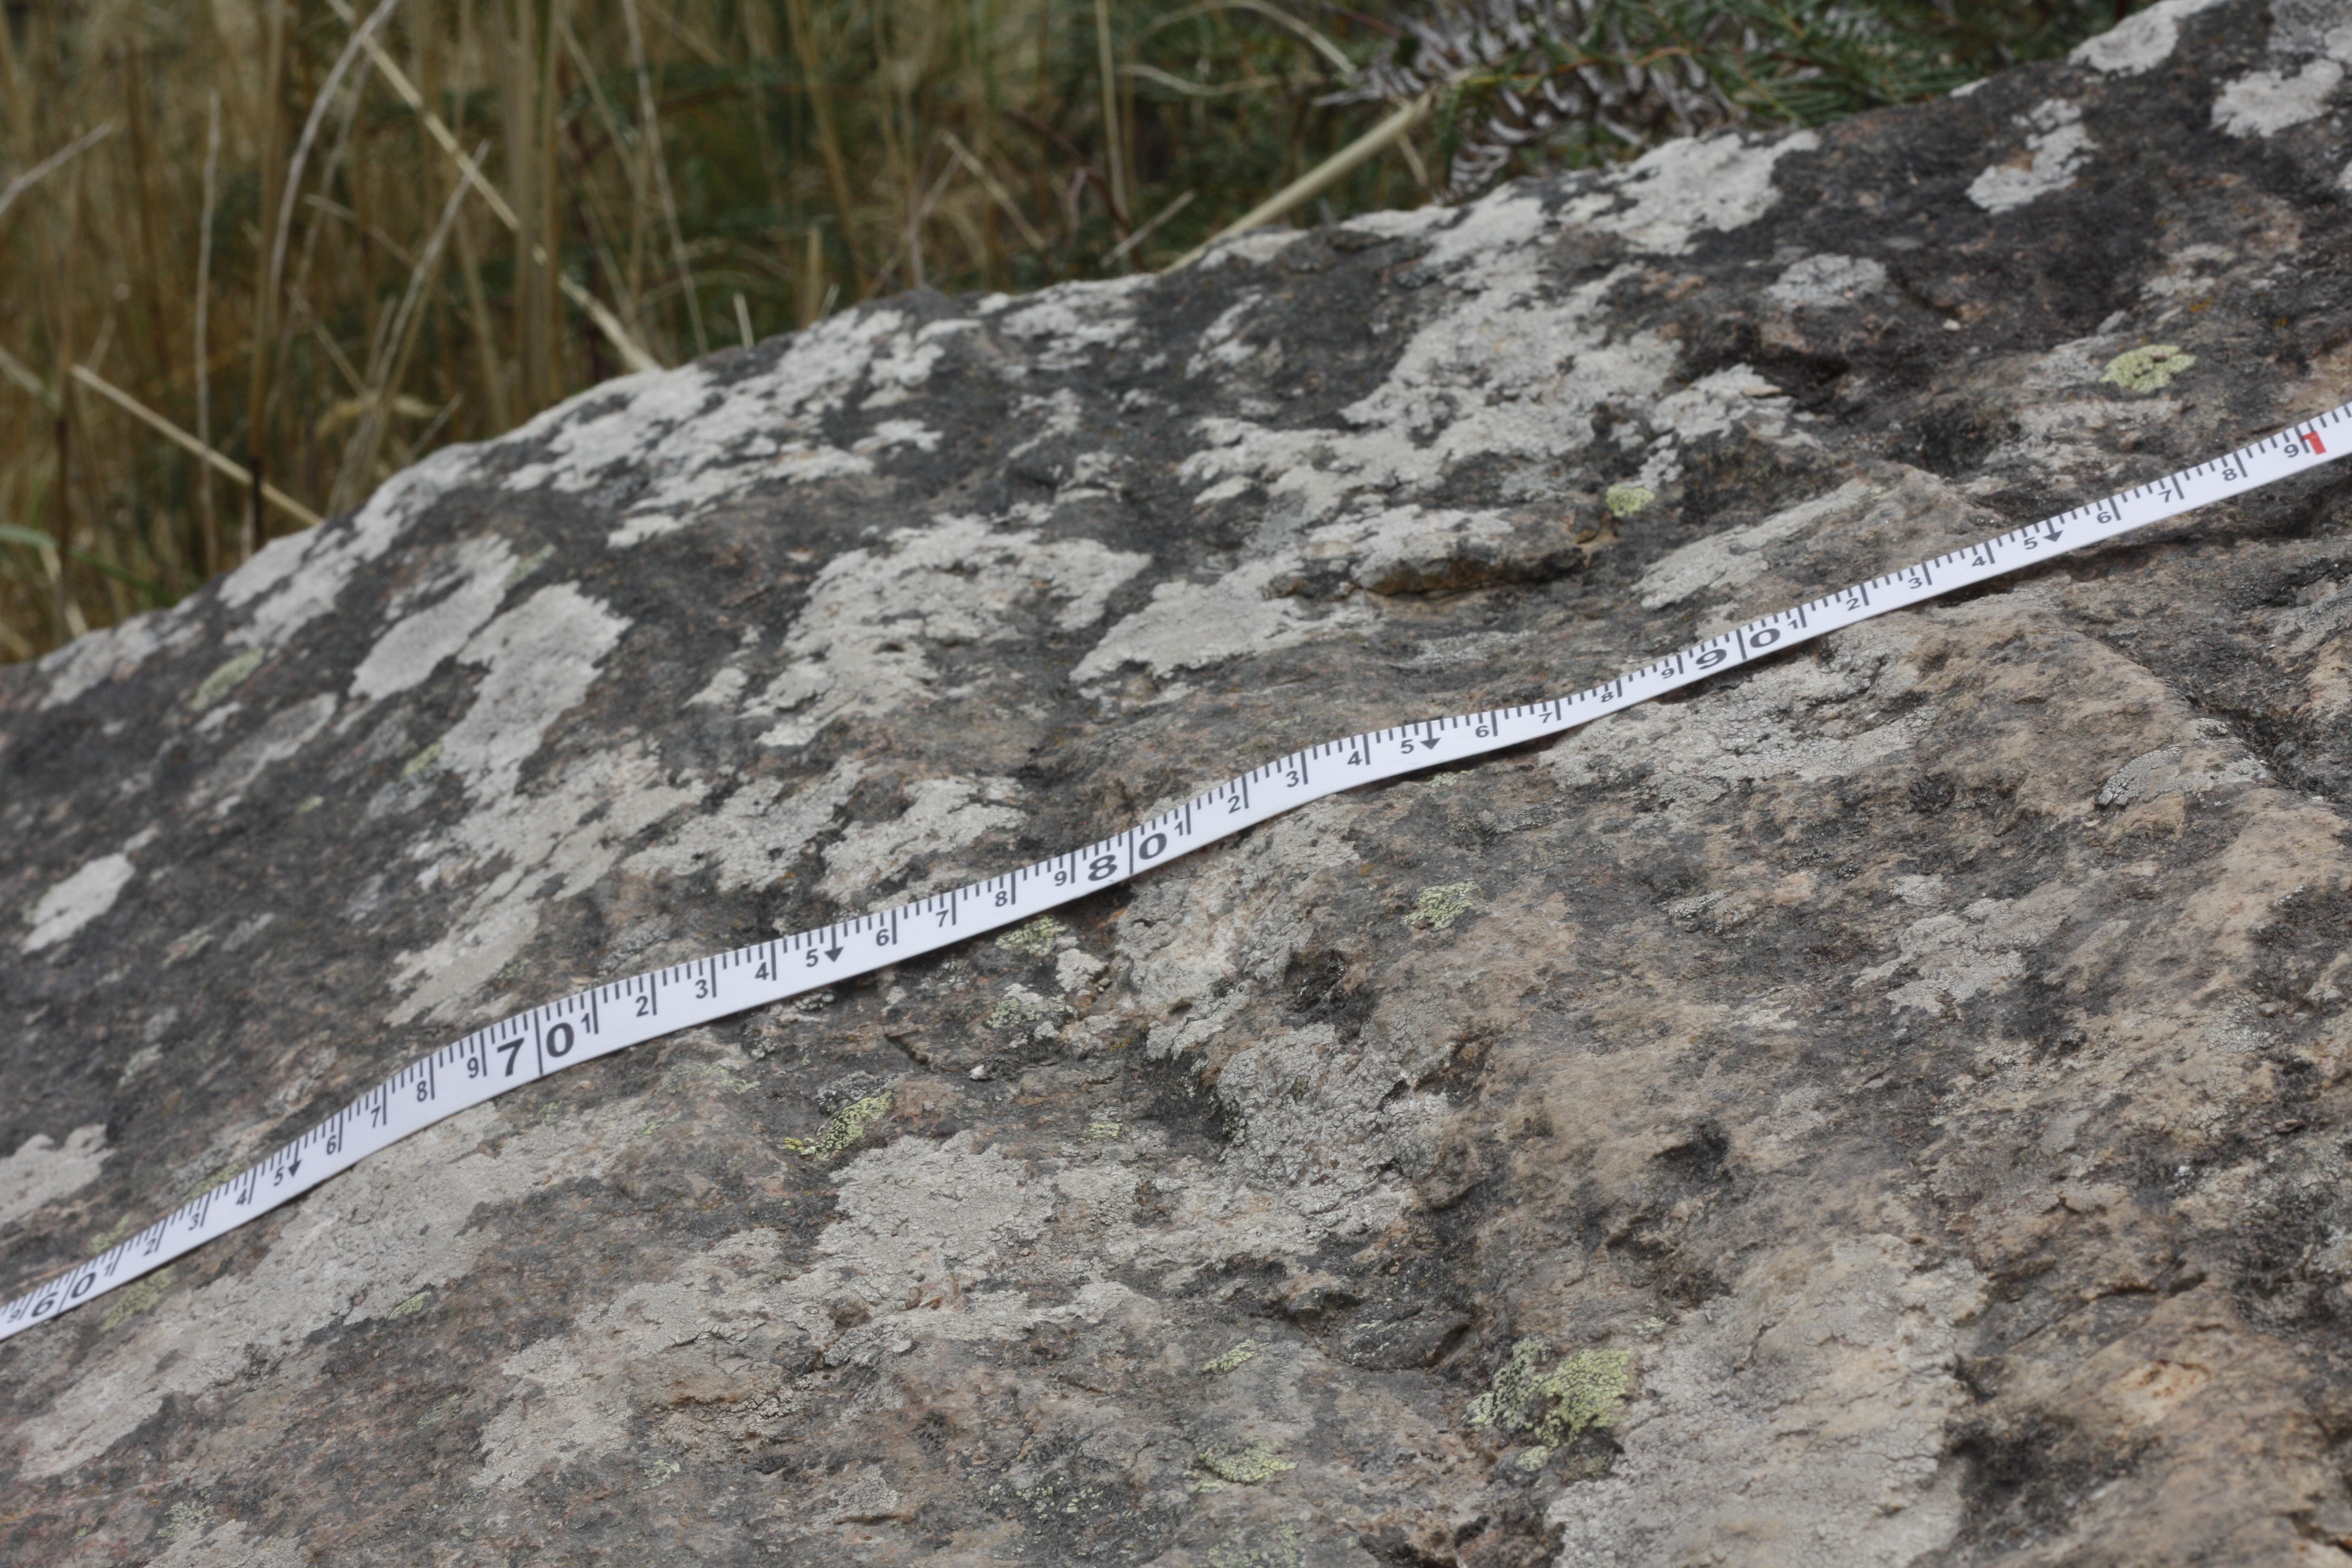
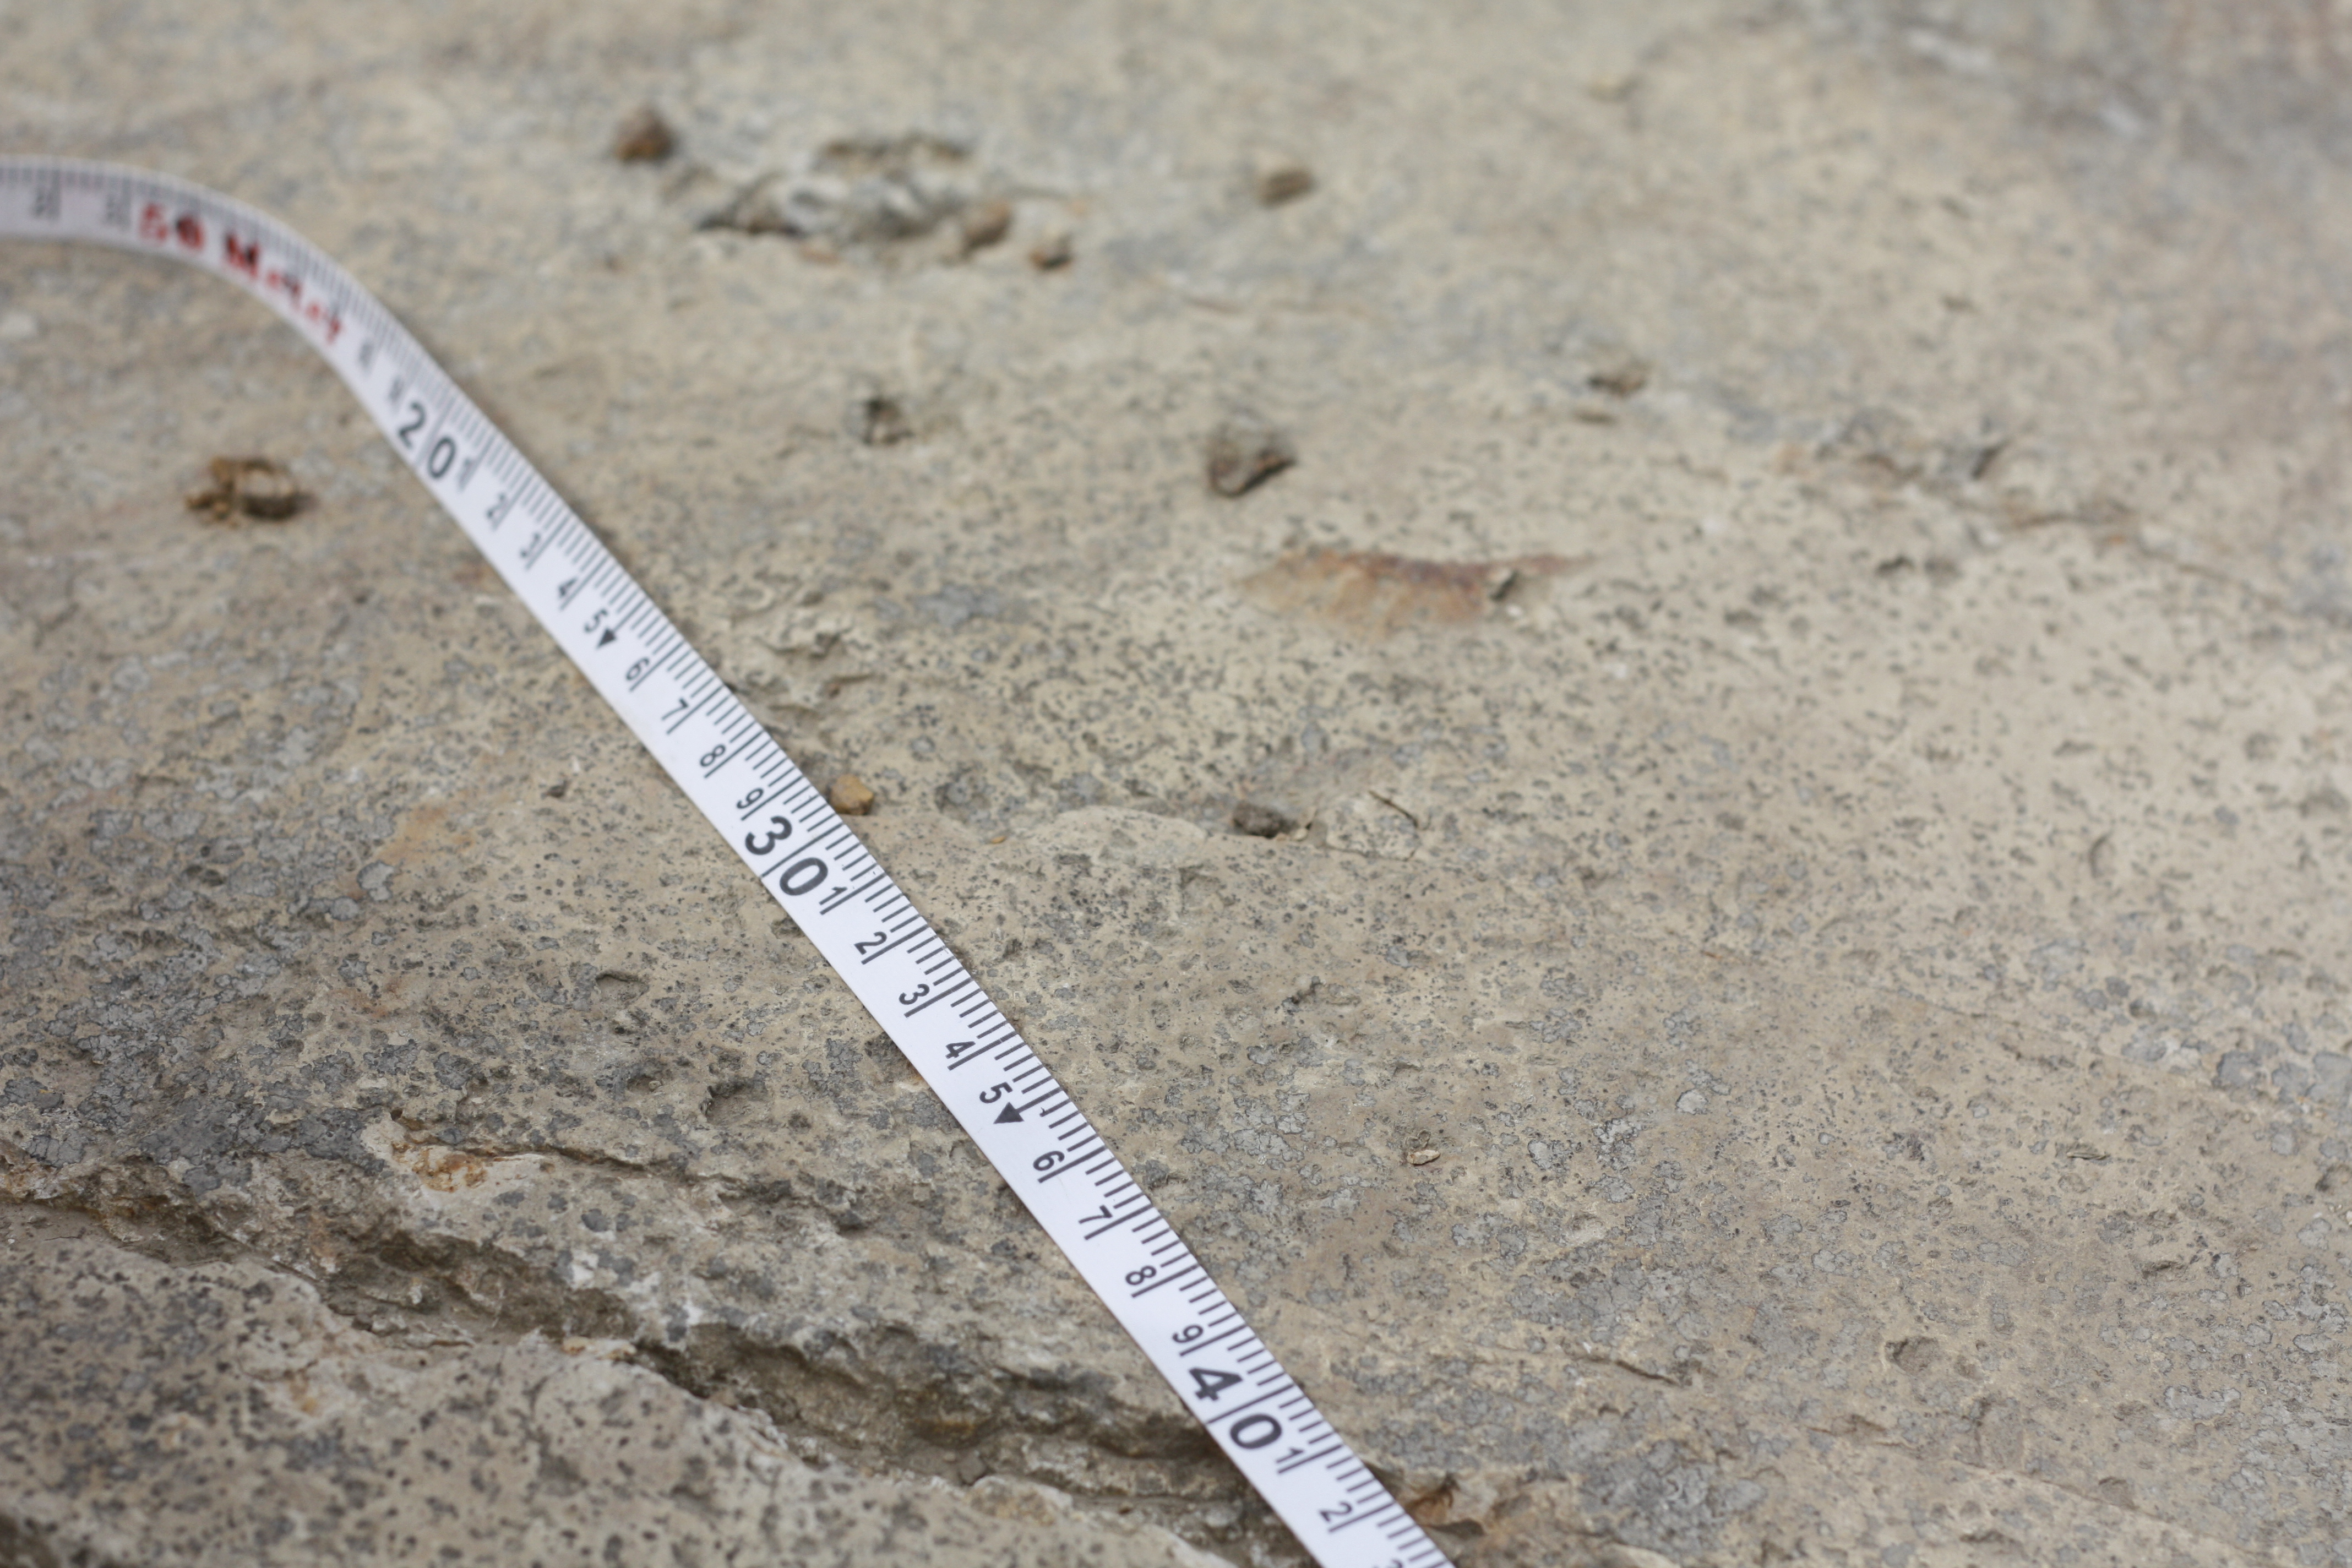
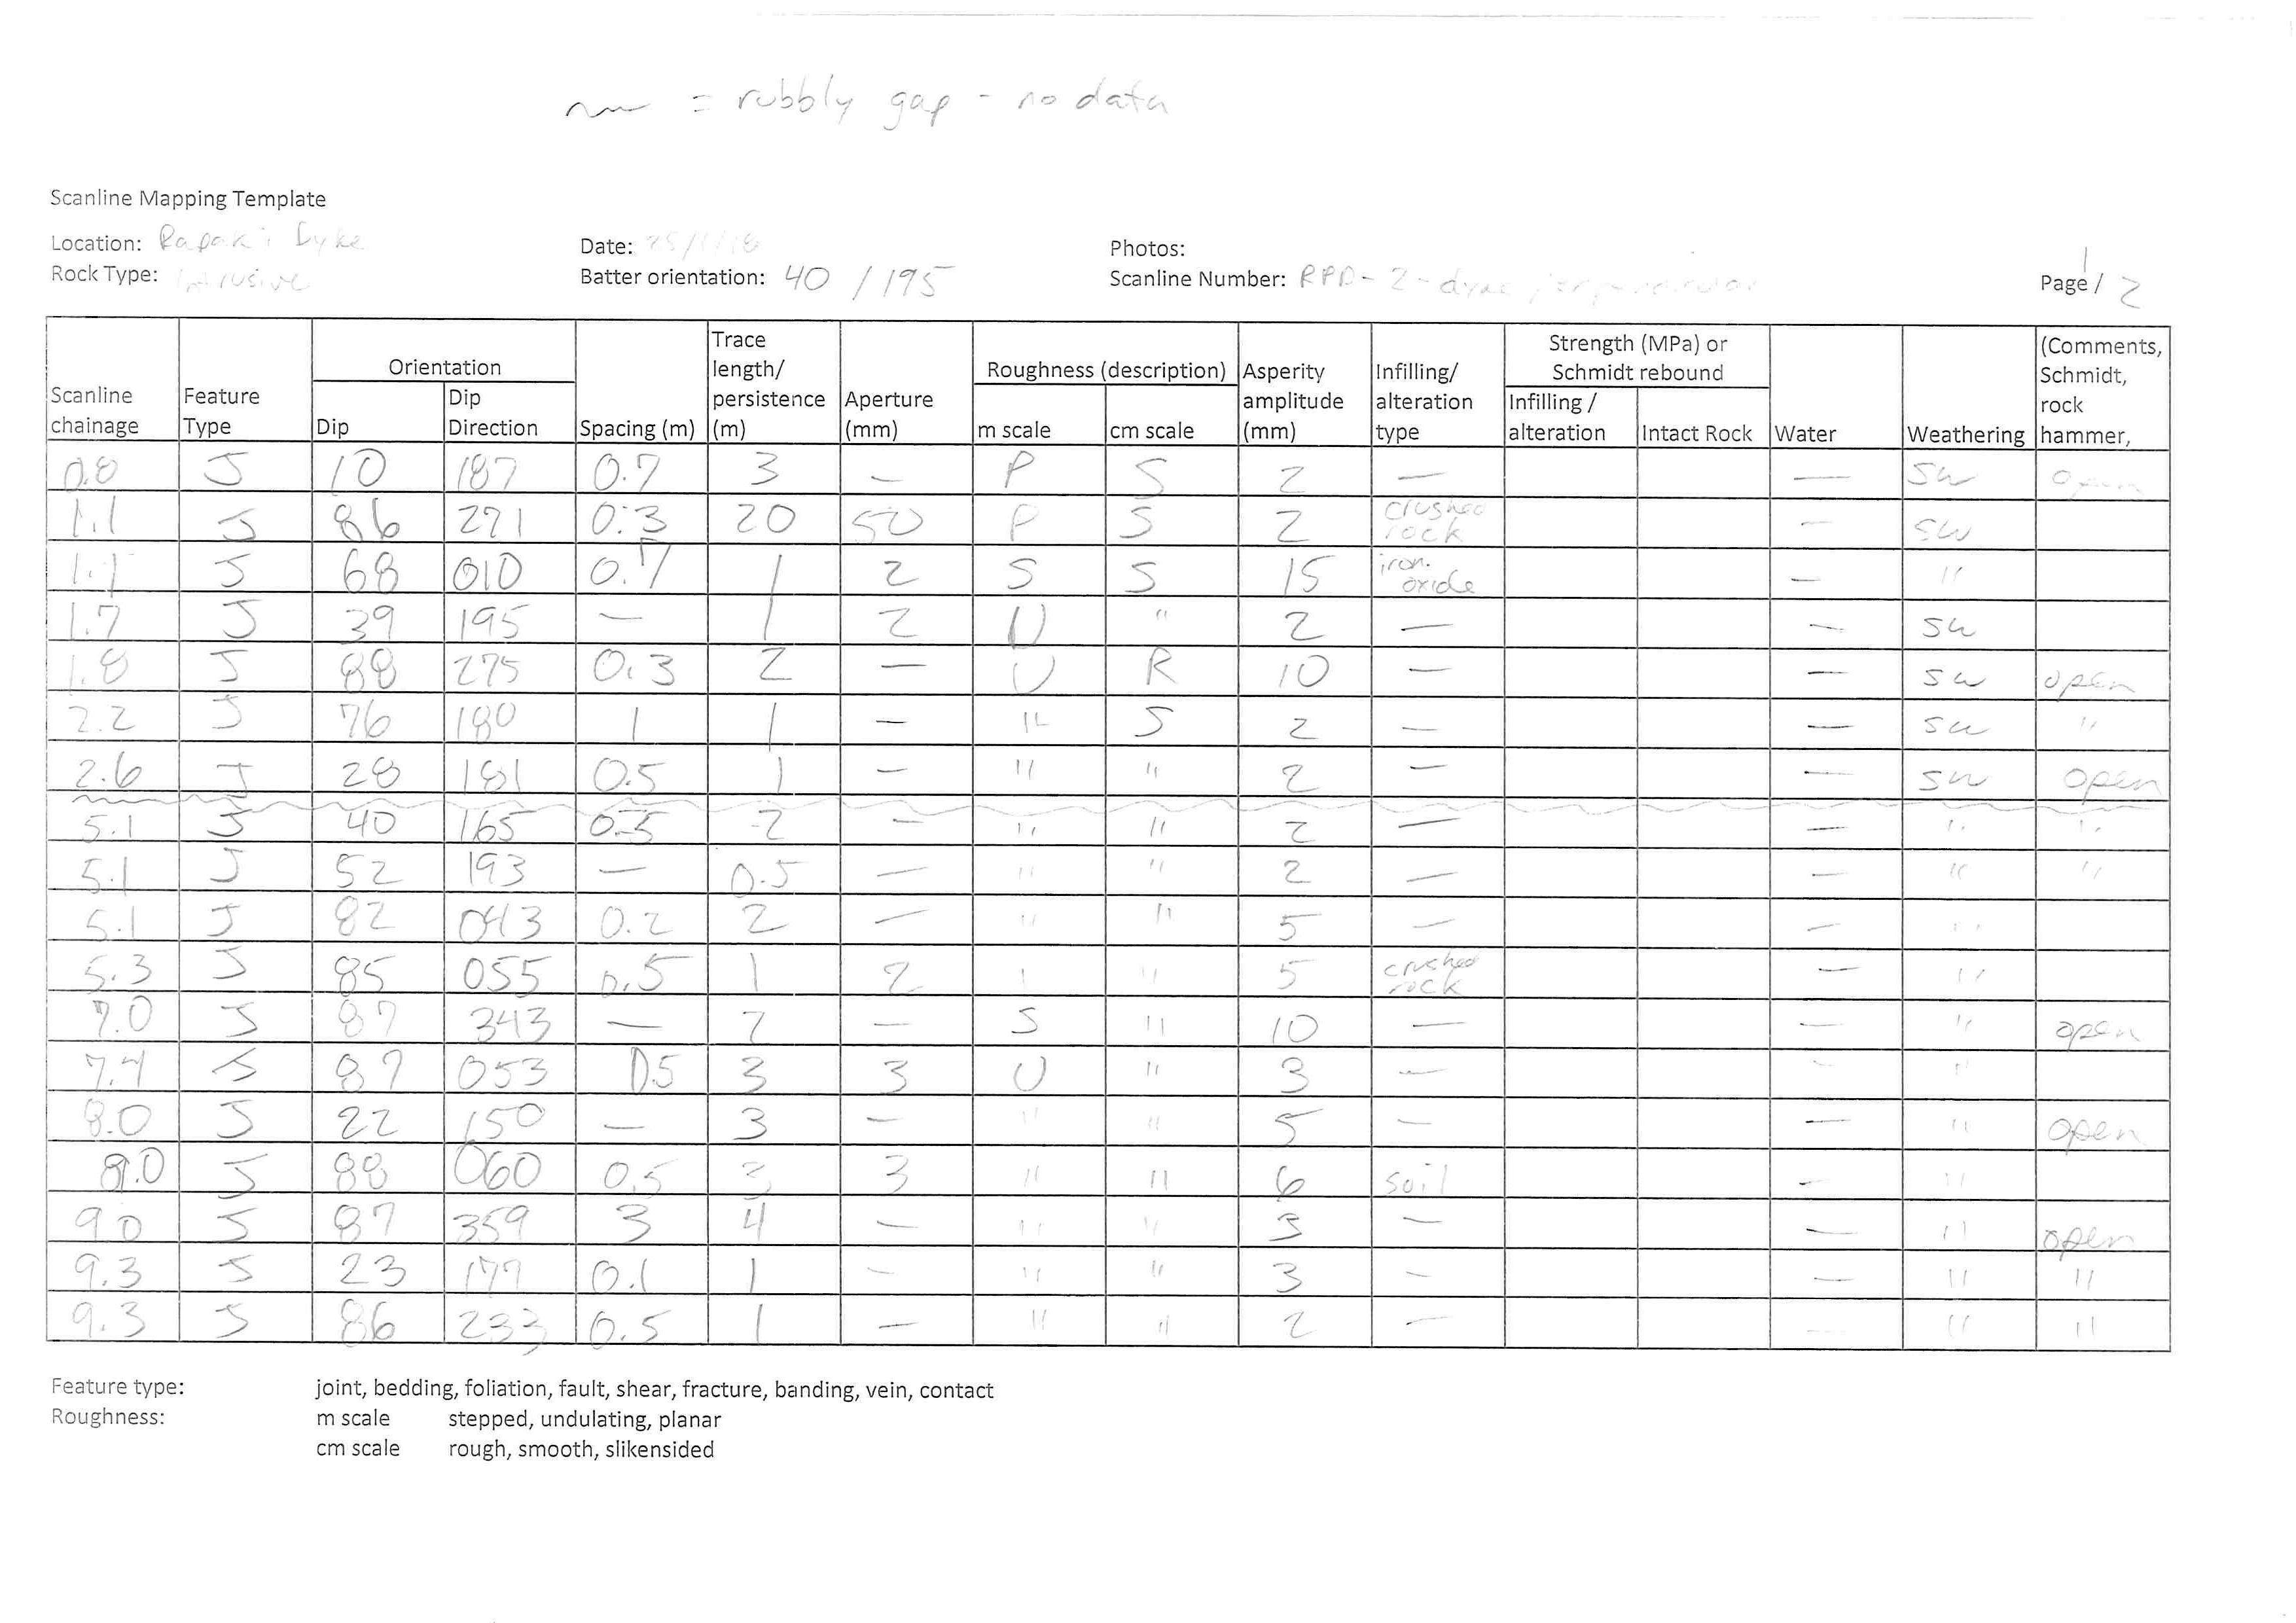
Scanline Mapping
Scanline mapping allows us to systematically collect discontinuity data at the metre and centimetre scale for an outcrop. It entails placing a measuring tape across an outcrop and recording the observations for each discontinuity that crosses the outcrop. To reduce bias from parallel discontinuity sets, multiple scanline maps are often conducted at single outcrops. The data are recorded in a table or spreadsheet, similar to the one in this photo.
Complete a Scanline map of 5 m long horizontal line anywhere on the dyke
Use the ruler tool to draw a ~v5 m long scanline anywhere on the dyke.
Use one row per discontinuity that crosses the ruler line; add more rows as needed. Aim for a minimum of 4 or 5 discontinuities. For the orientation you can use cardinal directions and variations on vertical and horizontal.
Feedback
Click on the button below to get feedback on your answer
Rock Mass Classification
In addition to characterising individual discontinuities, we can also characterise the rock mass holistically. This brings our characterisation journey back to the large scale, but using the tools we gained by looking at the metre and centimetre scales.
Map those cracks!
- Approach by which geological characteristics of a rock mass are assigned values, or scores, which, when combined, provide a quantification of the rock mass
- Used for describing changes in rock mass characteristics
- Used as input parameters for design
Geological Strength Index
aka GSI
- Descriptive and largely qualitative tool for putting numbers to geology
- Structure and surface condition parameters combine to give a rating between 0 and 100
- Not very precise so usually recorded as a range

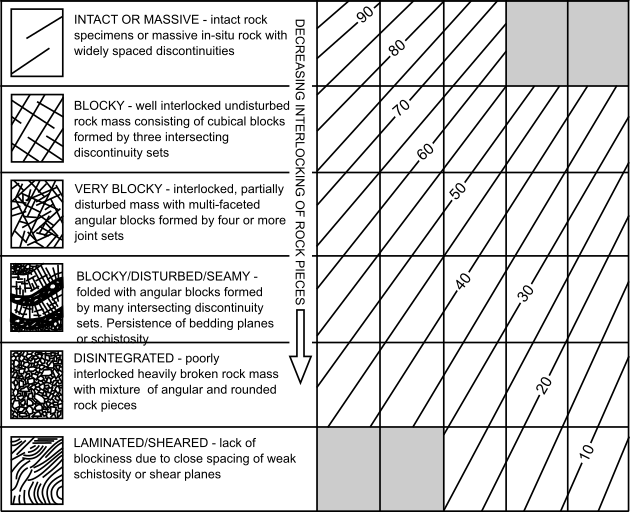
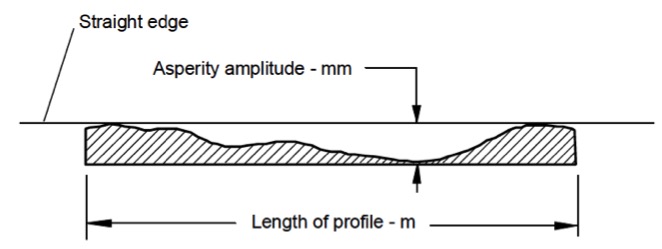
Vertical axis describes metre-scale rock structure → spacing, joint sets, interlocking
Horizontal axis describes centimetre-scale discontinuity surface condition → roughness, weathering, infilling
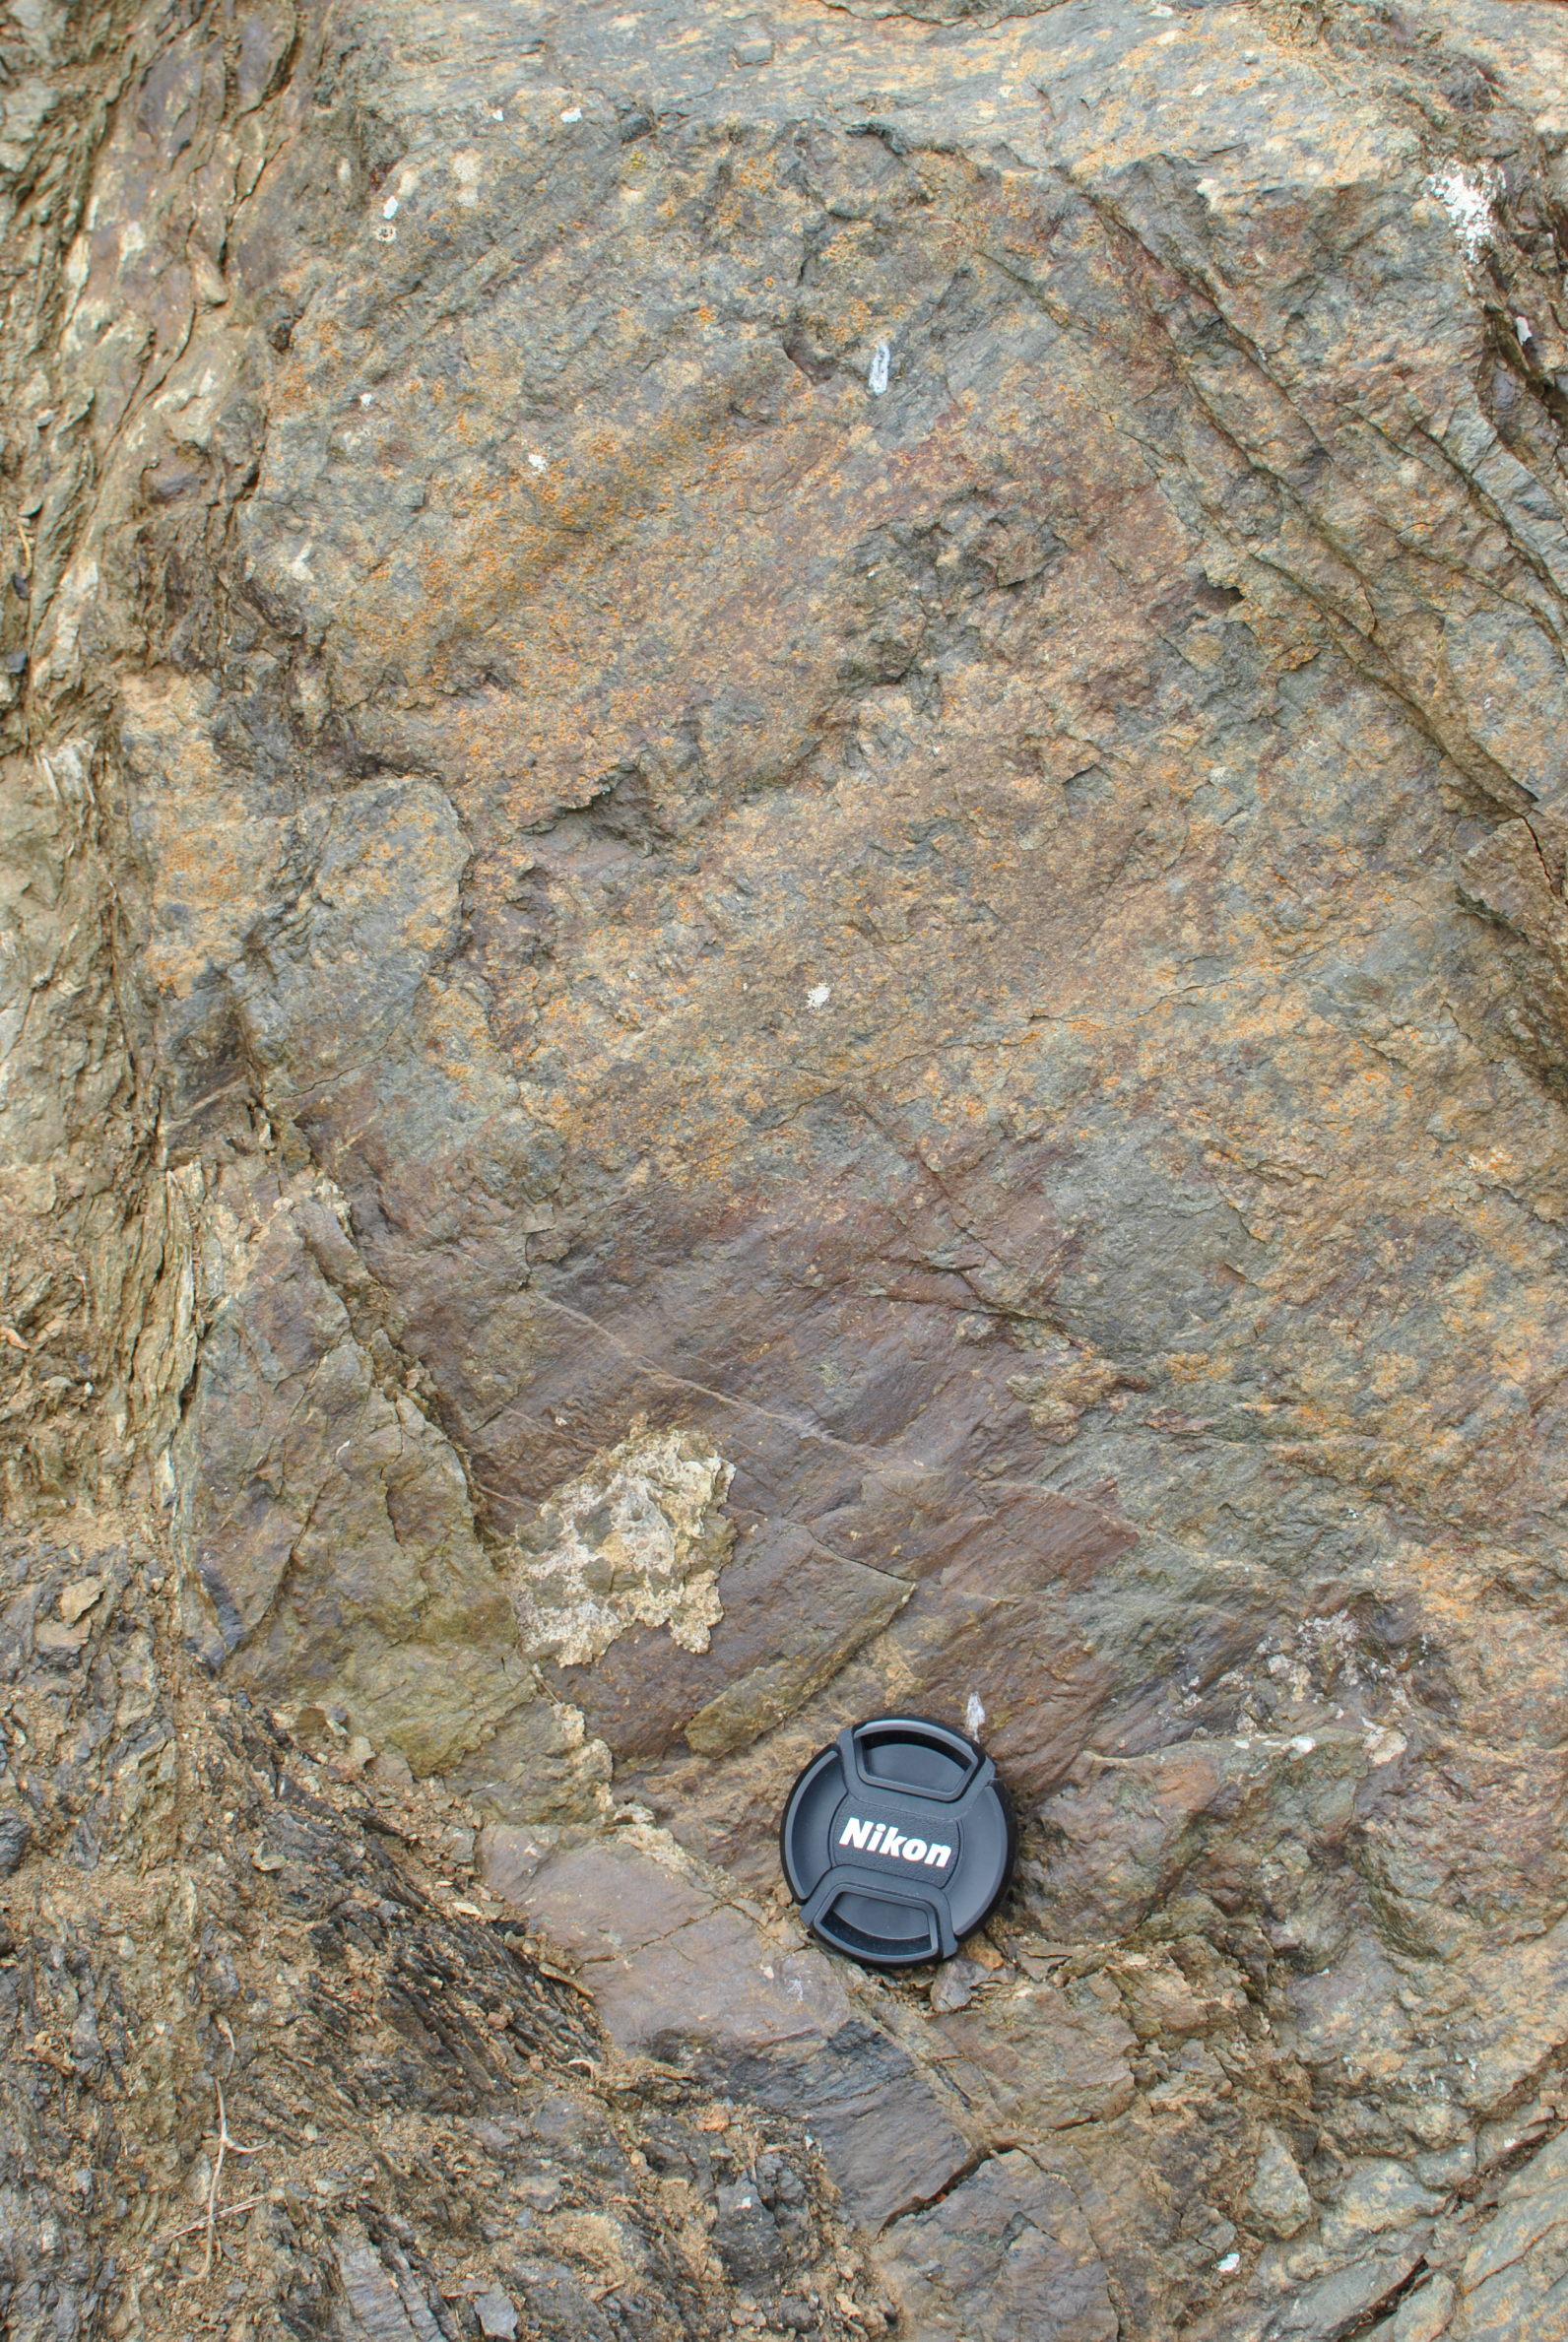
GSI practice
Let's practice!
Assess the rock structure & discontuinuity surface conditions to estimate a GSI range. Then click on the chart to see my estimate.


GSI Exercise
Let's see if you got it!
Determine the GSI in the zoomed in area.
Feedback
Click on the button below to get feedback on your answer
The End!!
Answer submission
Once you're confident in your answers...
When you think you are finished, you can click here to open a new tab that summarises your answers, and asks you a few more questions.